At the end of May, Harvard and MIT jointly released a dataset containing statistics about their online courses in the Academic Year of 2013. This Person-Course De-Identified dataset contains 641,138 events, chronicling 476,532 students who have taken up to 13 unique courses from a variety of topics.
However, this assortment of courses is not a substitution for a typical college education, as the vast majority of students only take one class.
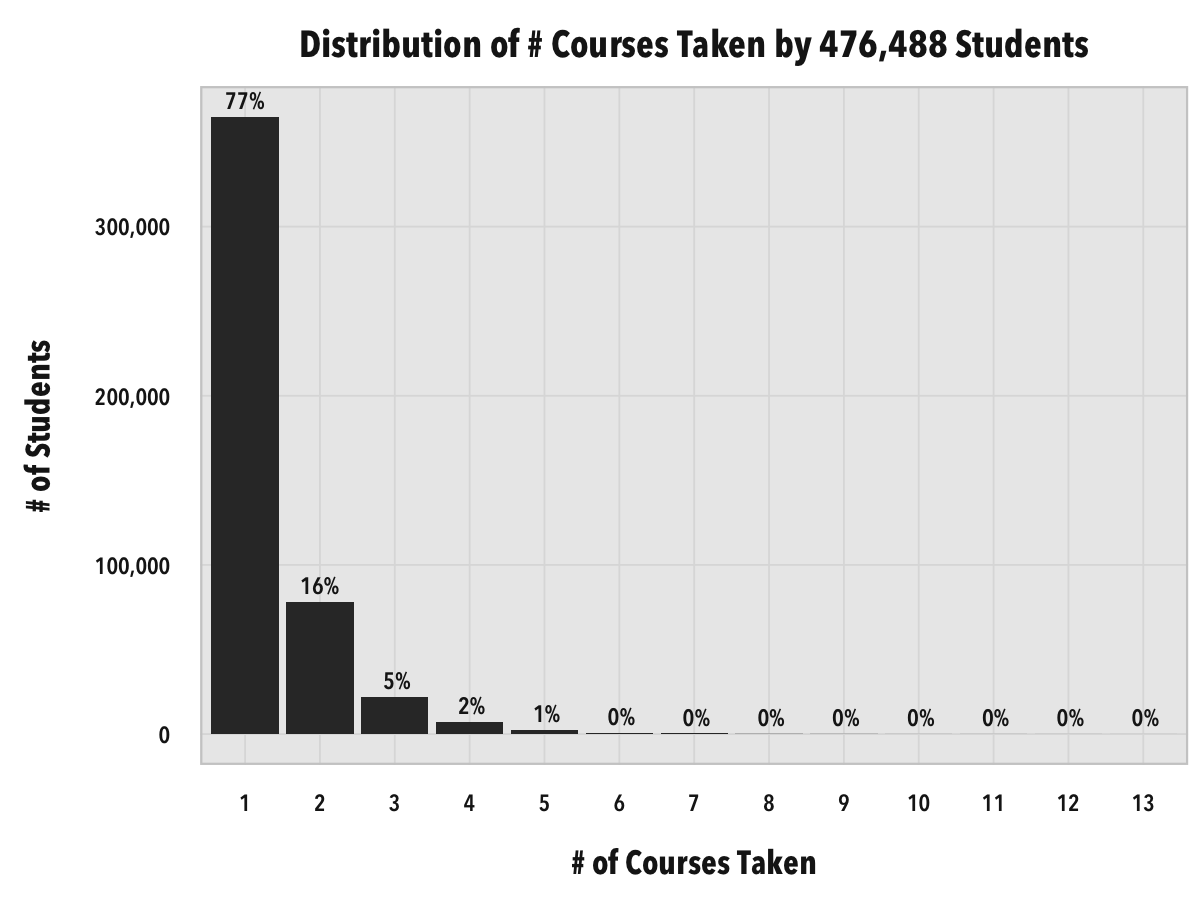
Very, very few students take more than one class (22% of all students).
Other interesting variables included with the data set are the level-of-education of the student, the birth date of the student, the gender of the student, and the geographical location of student.
Which types of student characteristics lead to the best performance in these online classes? That depends on how you define “performance.”
Here’s a look at the attendance of all the classes:
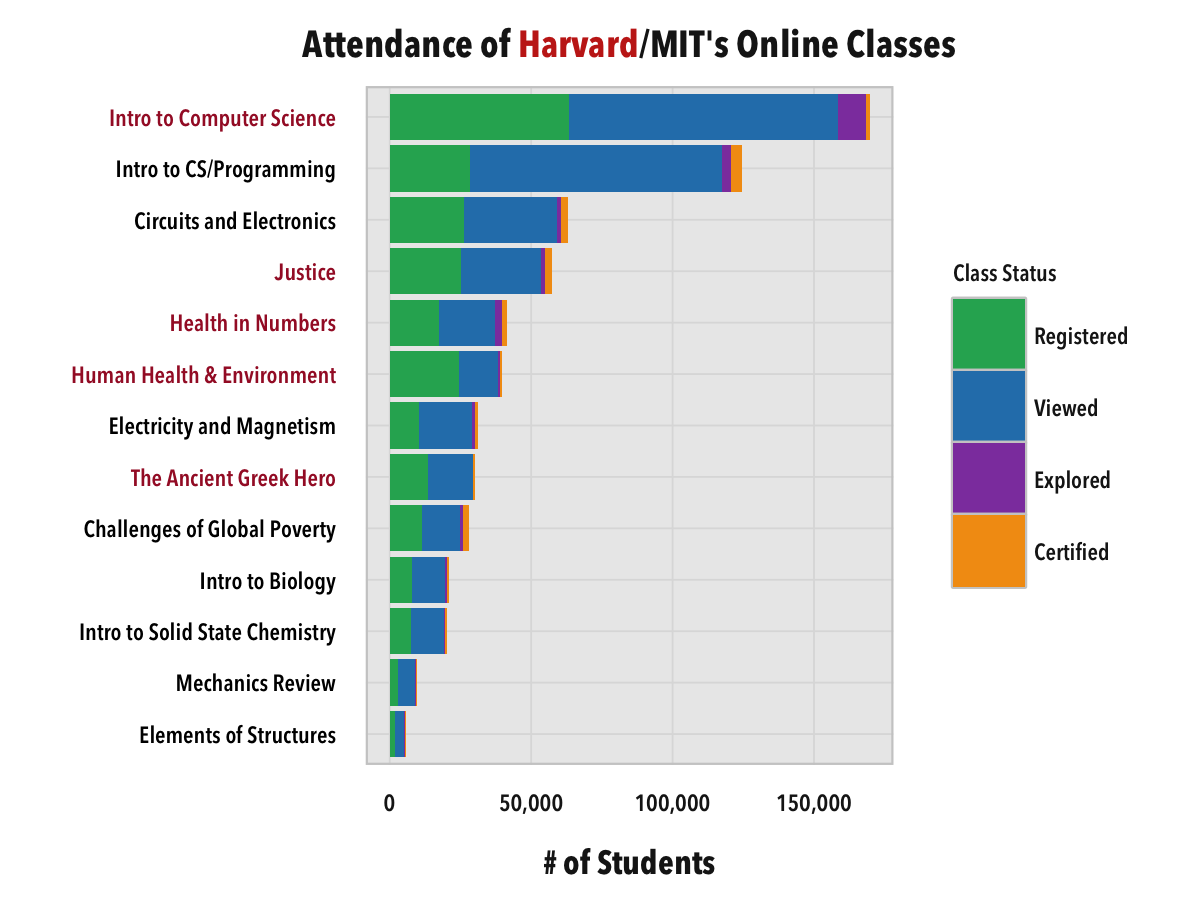
Harvard’s Introduction to Computer Science is by far the most popular class, and that’s only accounting for one semester. (it still beat MIT’s Intro to CS/Programming, which had 2 semesters).
Each color bar indicates the level of student participation in the class. Registered means the student simply registered for the class; Viewed means that the student viewed some of the course material, Explored means that students viewed atleast half of the course material, and Certified means that students completed the course and received a certificate of accomplishment. For the chart, it’s interesting to note that most classes have a high percentage of people in each class who simply register just for fun and don’t actually do anything.
One metric of course success is the completion rate of each course, i.e. how many people actually complete the course after starting it. A frequent criticism of free online classes is that this number is very low, but what are the actual completion rates of these 13 classes?
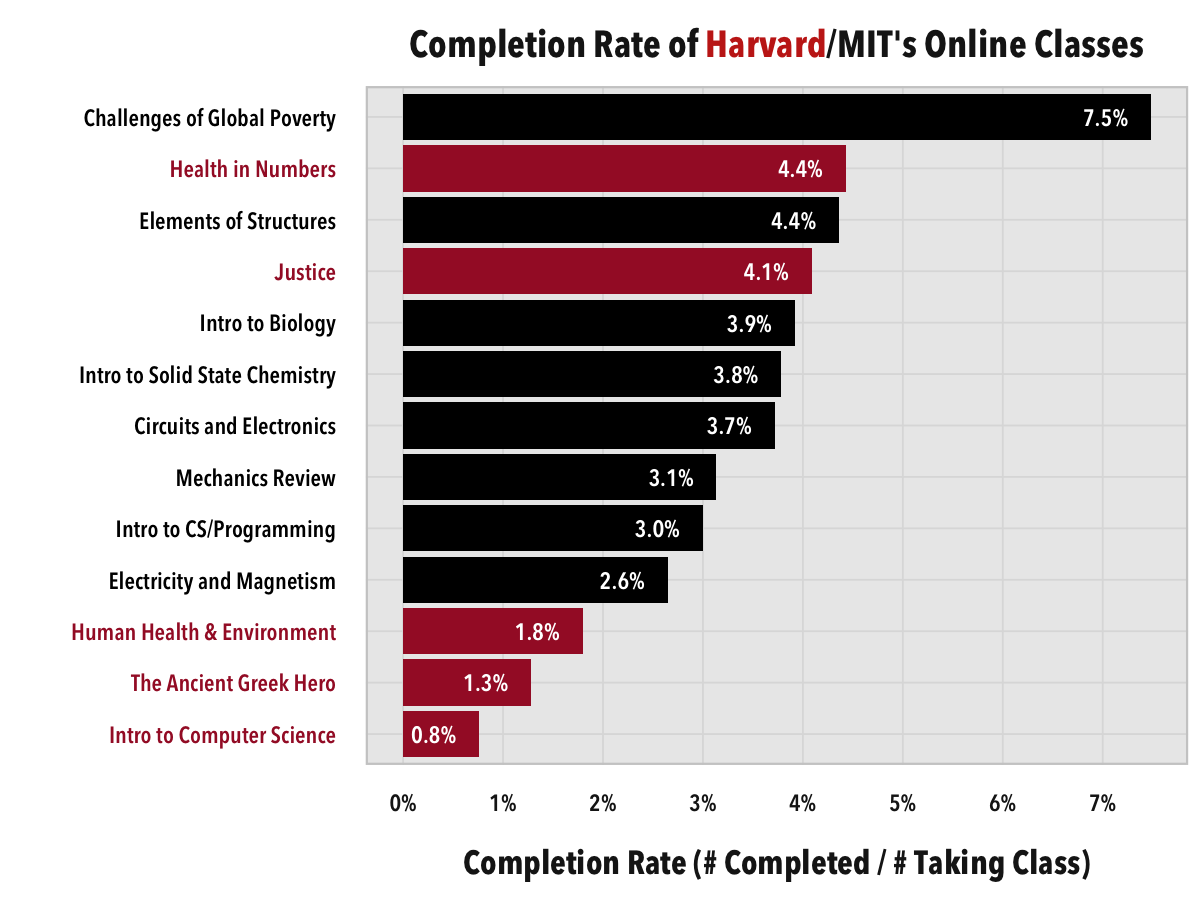
Completion rates are low across the board, from 0.8% to 7.5%. A 2013 study found that completion rate is less than 7%, which this data follows. Apparently, Challenges of Global Poverty is a very interesting course.
After the student completes a class, he or she receives a final grade, and if the grade is above the cutoff point (usually 50% - 80%), they will complete the class and receive the certificate. Here’s the distribution of the average grades for students in each class, given that the student has successfully completed the class:
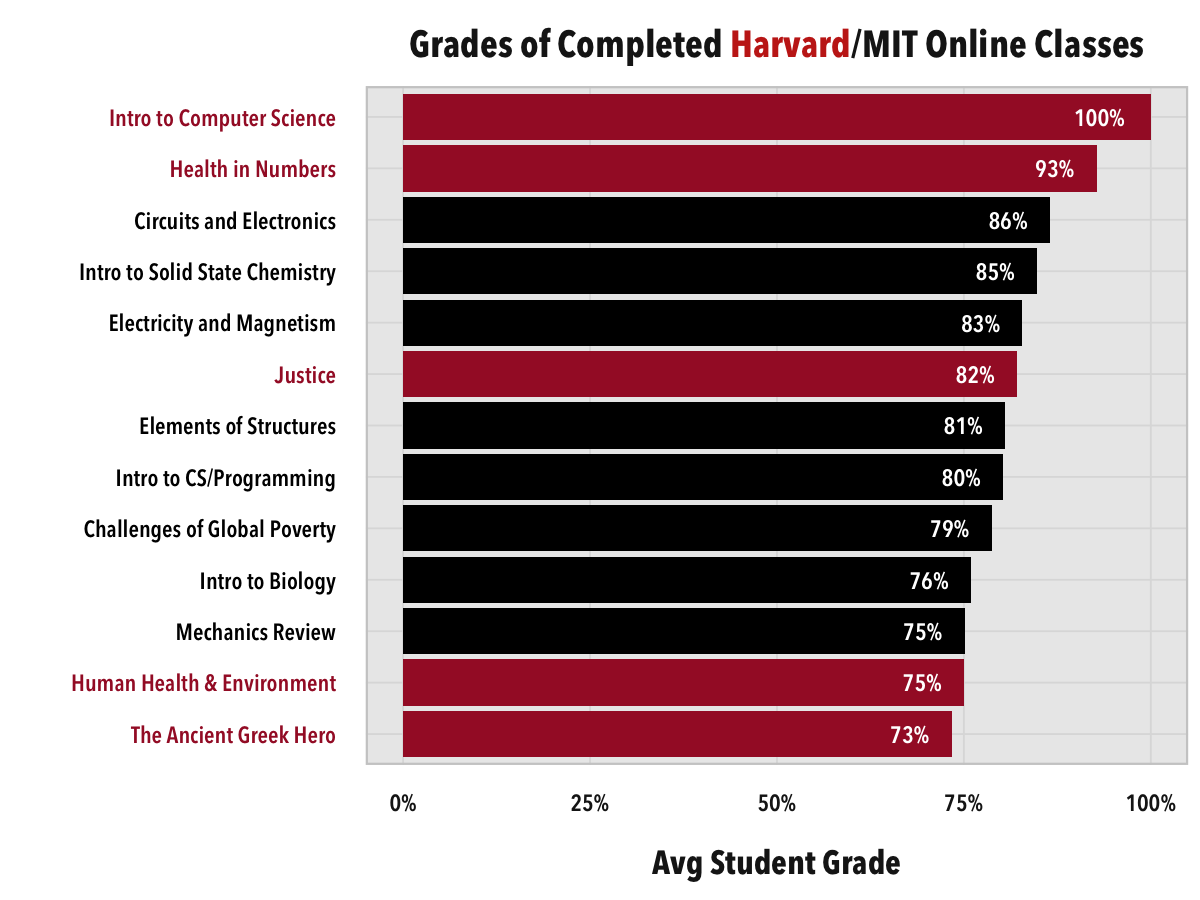
The grades vary significantly between classes. This doesn’t necessarily imply that some classes are harder than others; it’s possible some classes had lower cutoffs and therefore the effort put in by the students is lower. However, the perfect 100% average for Harvard’s Intro to CS course implies that the class is pass/fail and that students can’t get a final grade less than 100%. (as a result, we’ll need to remove that class from future grade analyses in order to prevent bias due to the lack of score variance)
Age
Online classes are marketed toward college-age students.
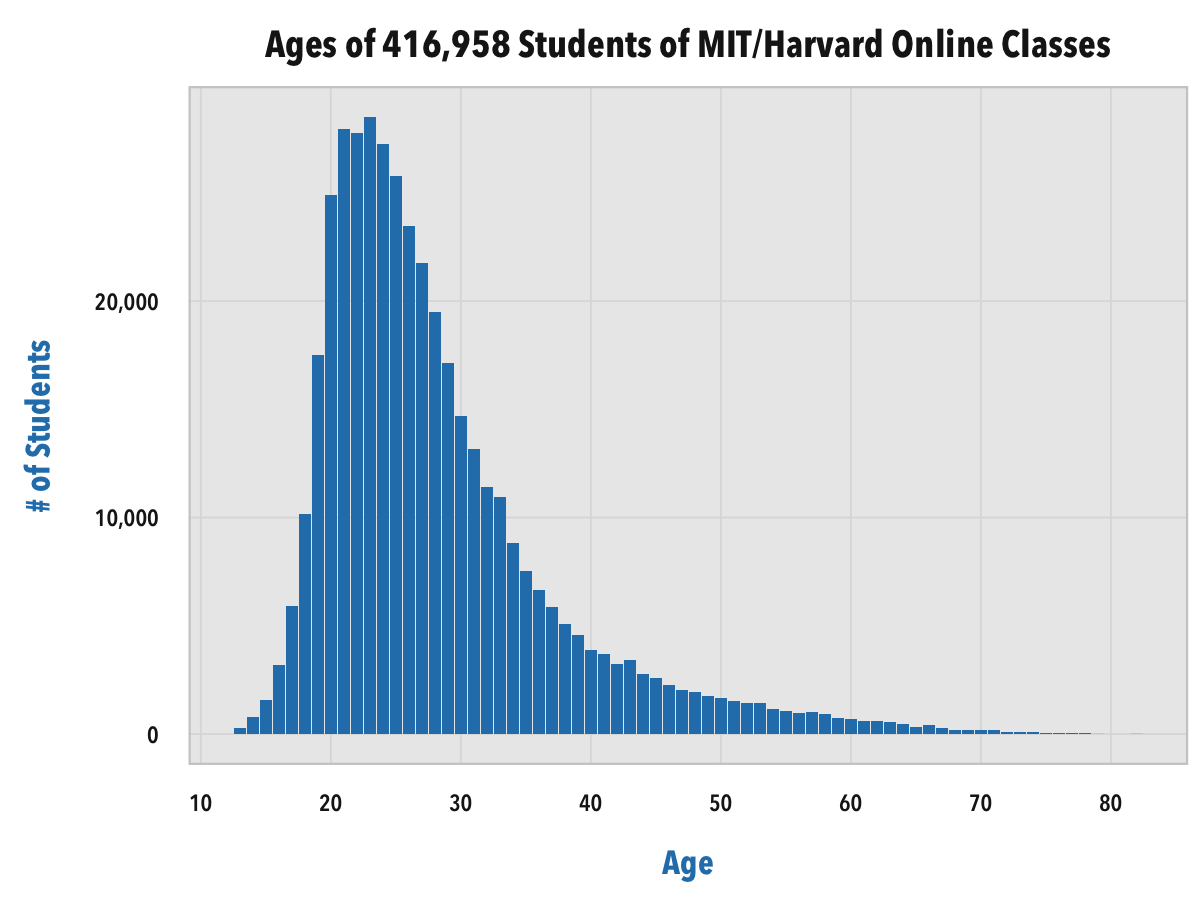
The mean age is about 27.7, with a standard deviation of 8.89. The shape skews right and resembles a gamma distribution. There are even plenty of teenagers taking these classes too.
The proportion of students who take more than one class for each age group has a slightly flatter distribution, although more centralized at students in their 20’s.
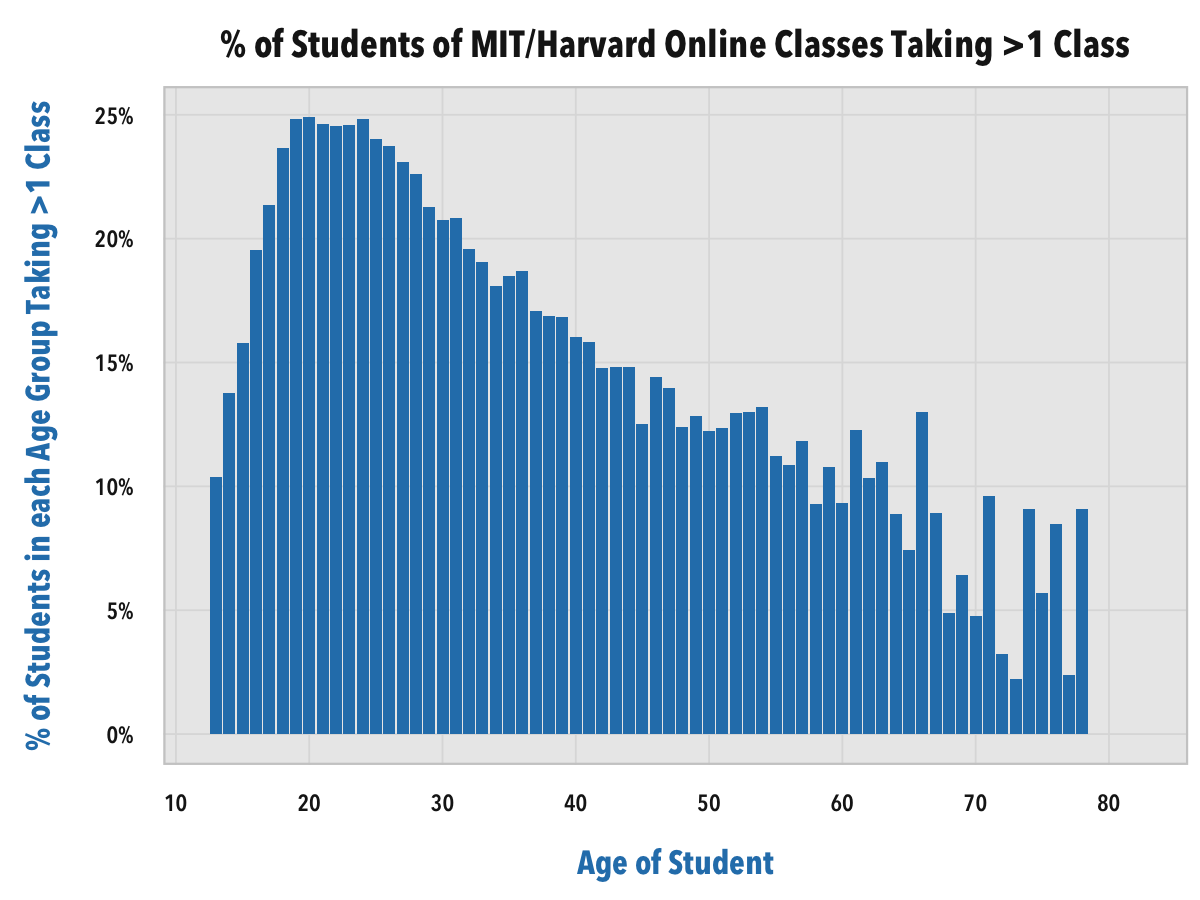
What about completion rate?
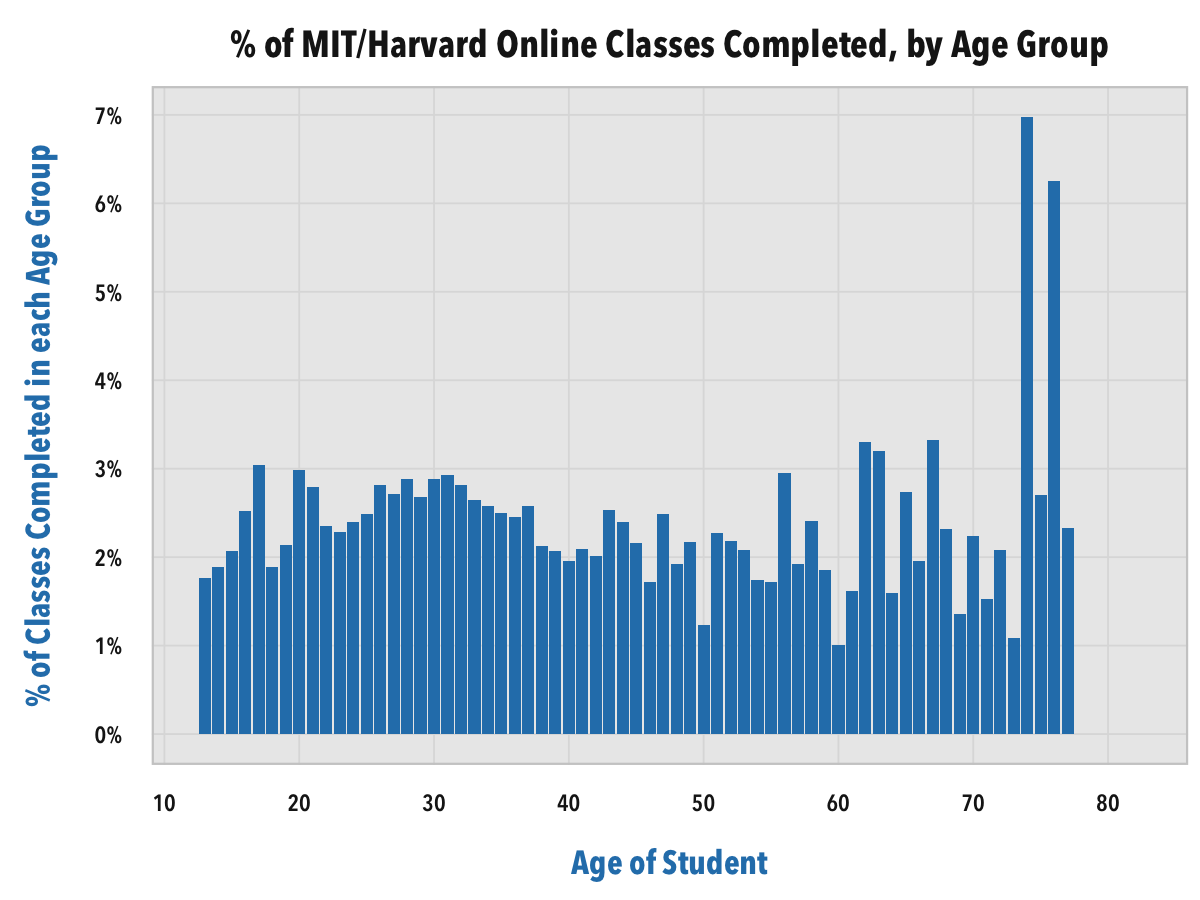
Completion rate is a little more evenly distributed between the ages, indicating that the two metrics are likely uncorrelated. However, the older students have nearly double the completion rate of classes. (more on this later)
Education
One of the student-provided attributes is his or her highest level of education. These values are “Less than Secondary,” “Secondary”, “Bachelor’s”, “Master’s”, and “Doctorate.” Here’s the distribution of the 409,601 students who provided their LoE:
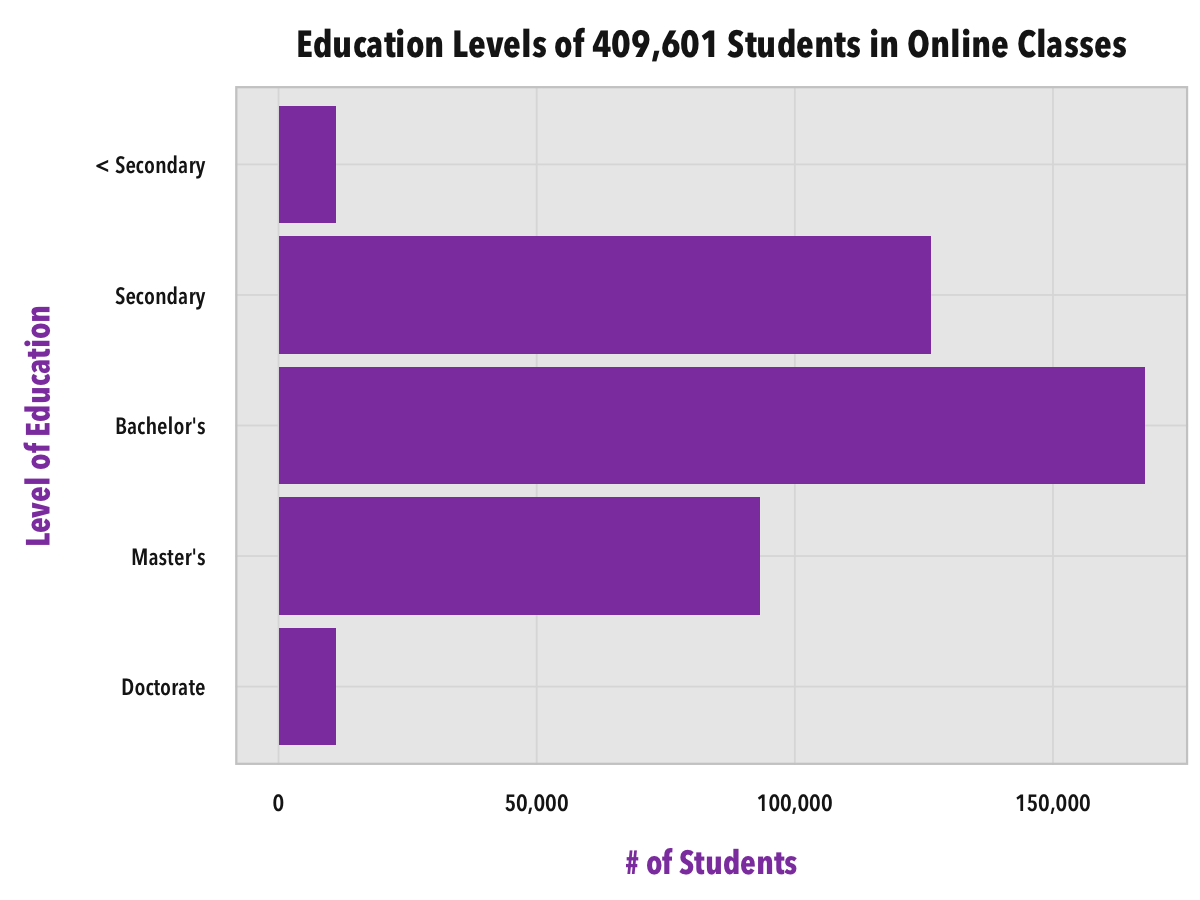
This shows that the majority of students who are taking these online classes have already finished college and already obtained a degree, and therefore are likely taking the course as supplemental material.
We can correlate the levels of education with the average age for each LoE as a double-check.
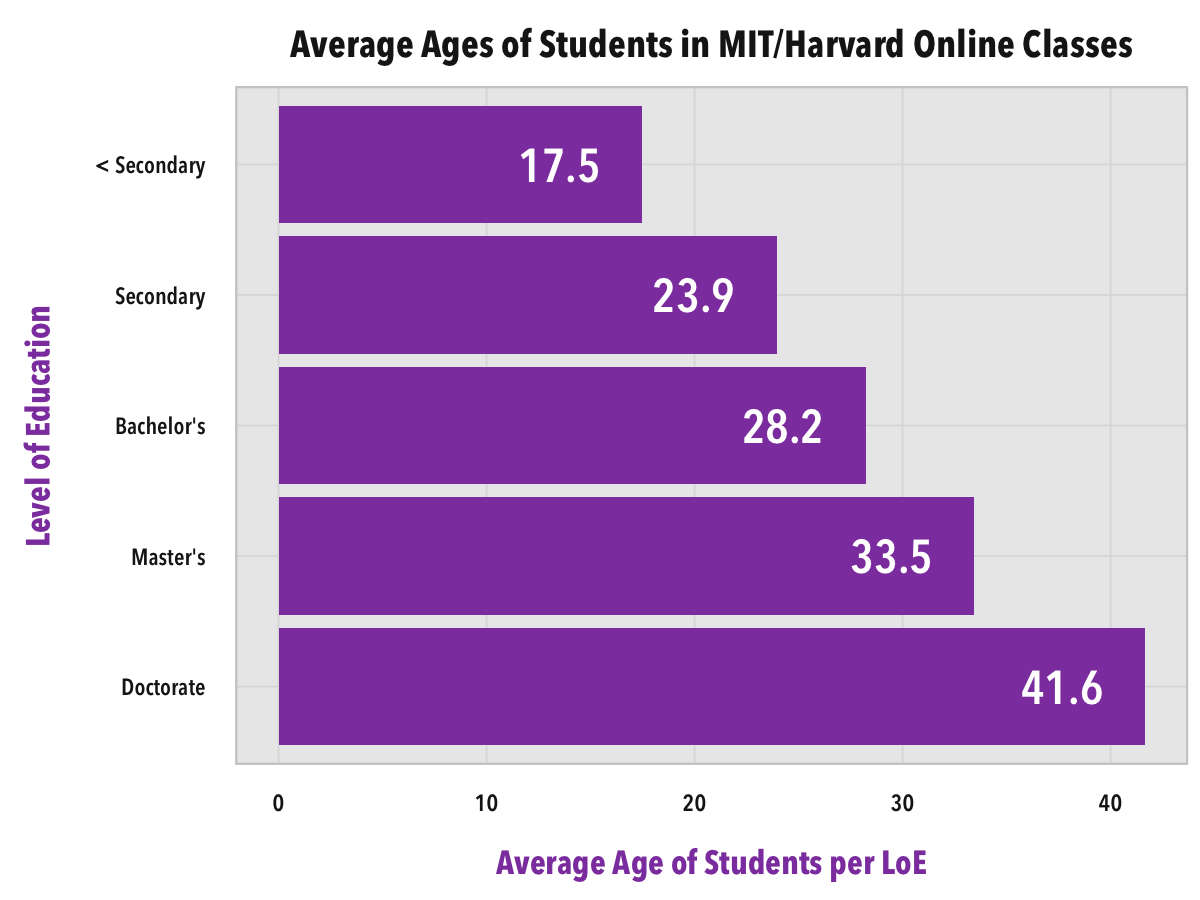
Indeed, each LoE average age is above the minimum expected threshold of time needed for each degree (~18 years for Secondary, ~22 years for Bachelor’s, etc.)
How does the completion rate vary?
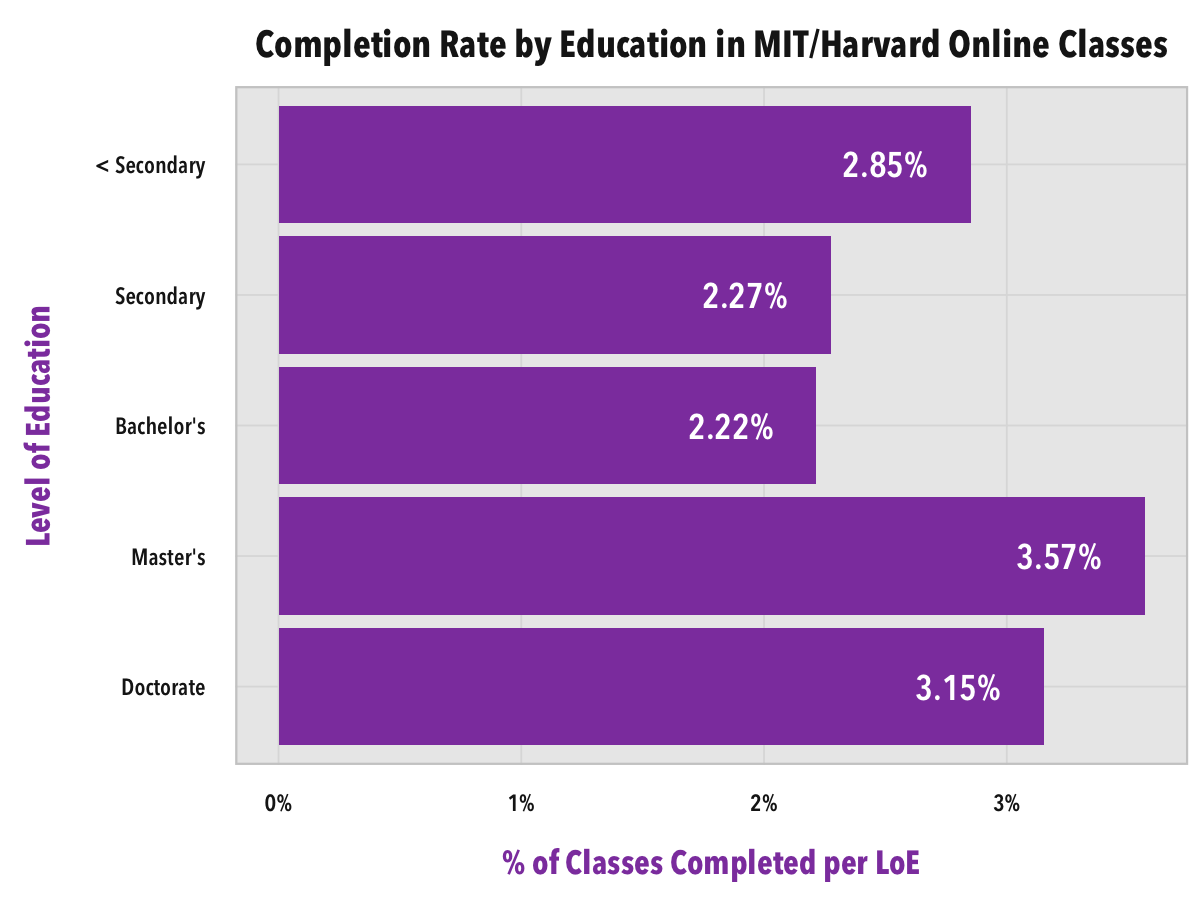
Interestingly, those with Less than Secondary education have a much higher completion rate than those with Secondary educations and Bachelor’s Degrees.
But are Doctorate smarter than those with lower education levels? Do they get higher grades on average?
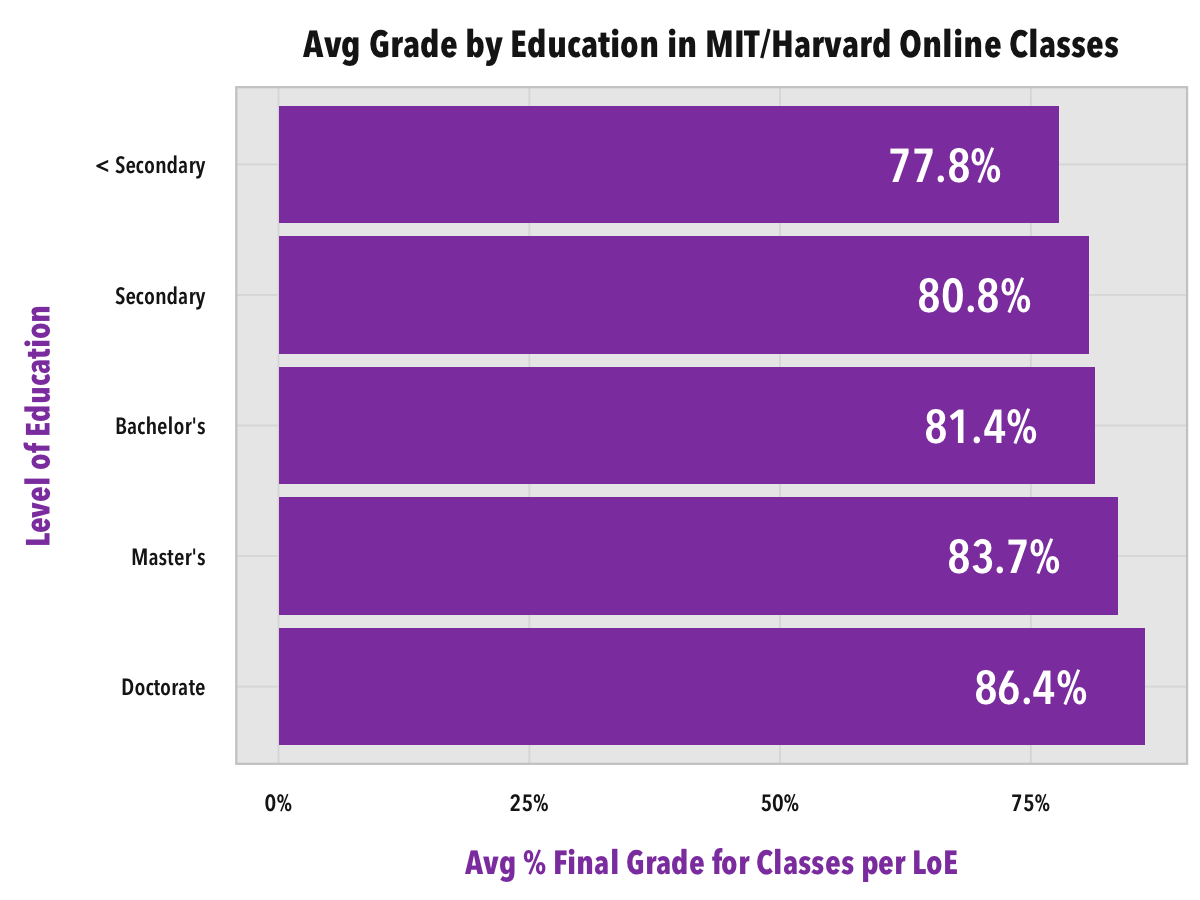
As it turns out, yes. The education level of a student is very relevant to a his or her academic performance in online classes.
Gender
I previously made a blog post discussing the genders of students and the proportion of students by course. As it turns out, gender is a very important part of the student body composition.
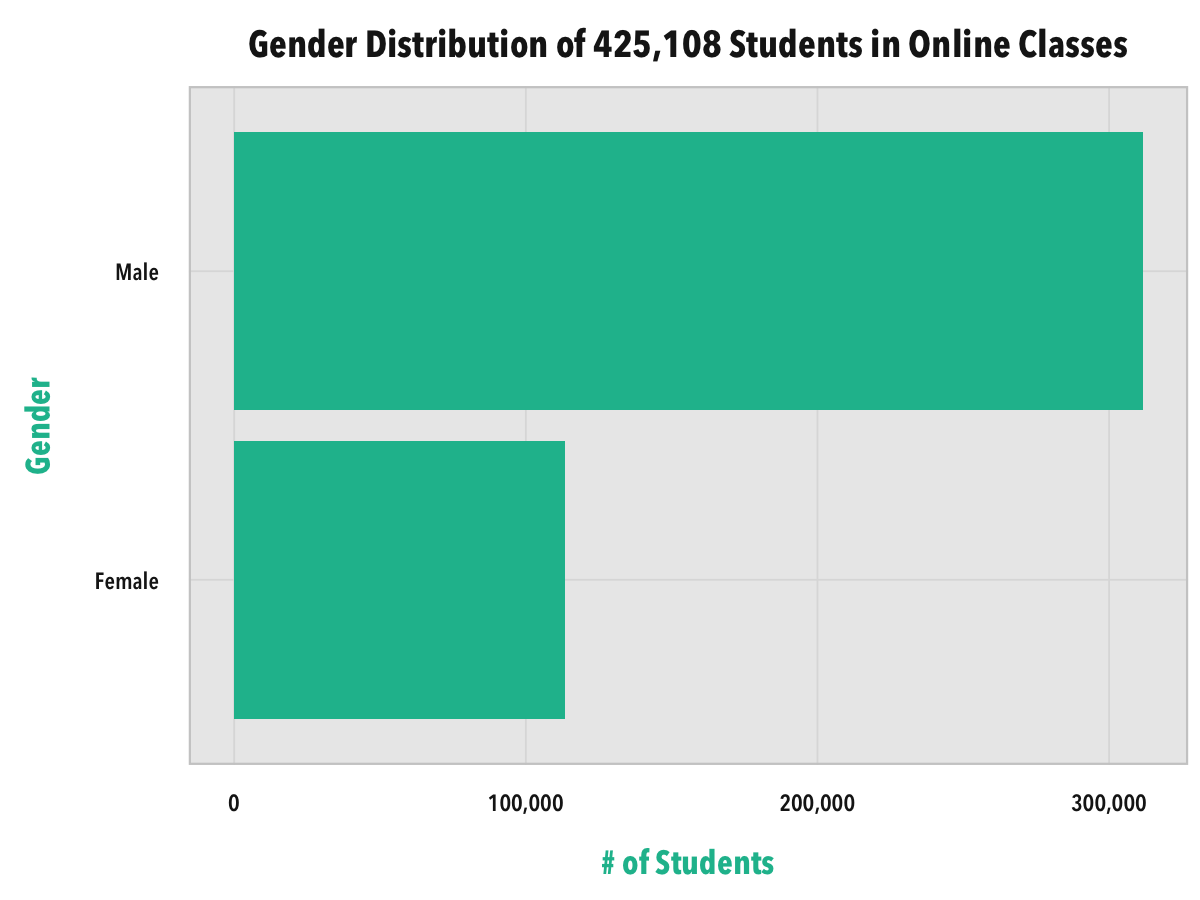
425,108 students have a gender on record, with 311,534 male students (73.3%) and 113,571 female students (26.7%). The fact that it’s not even close to 50:50 is surprising.
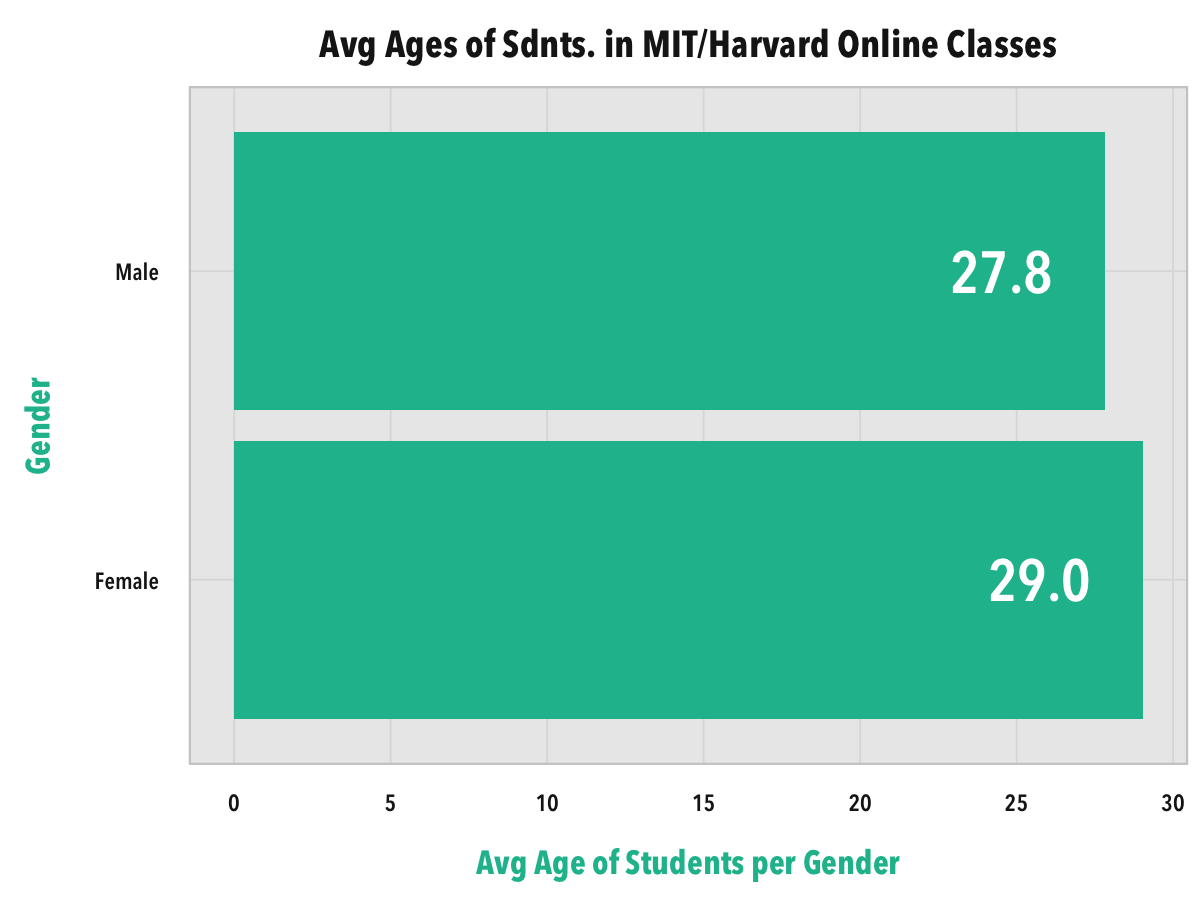
Age wise, there’s not much difference between the genders. Female students are about a year older than male students on average.
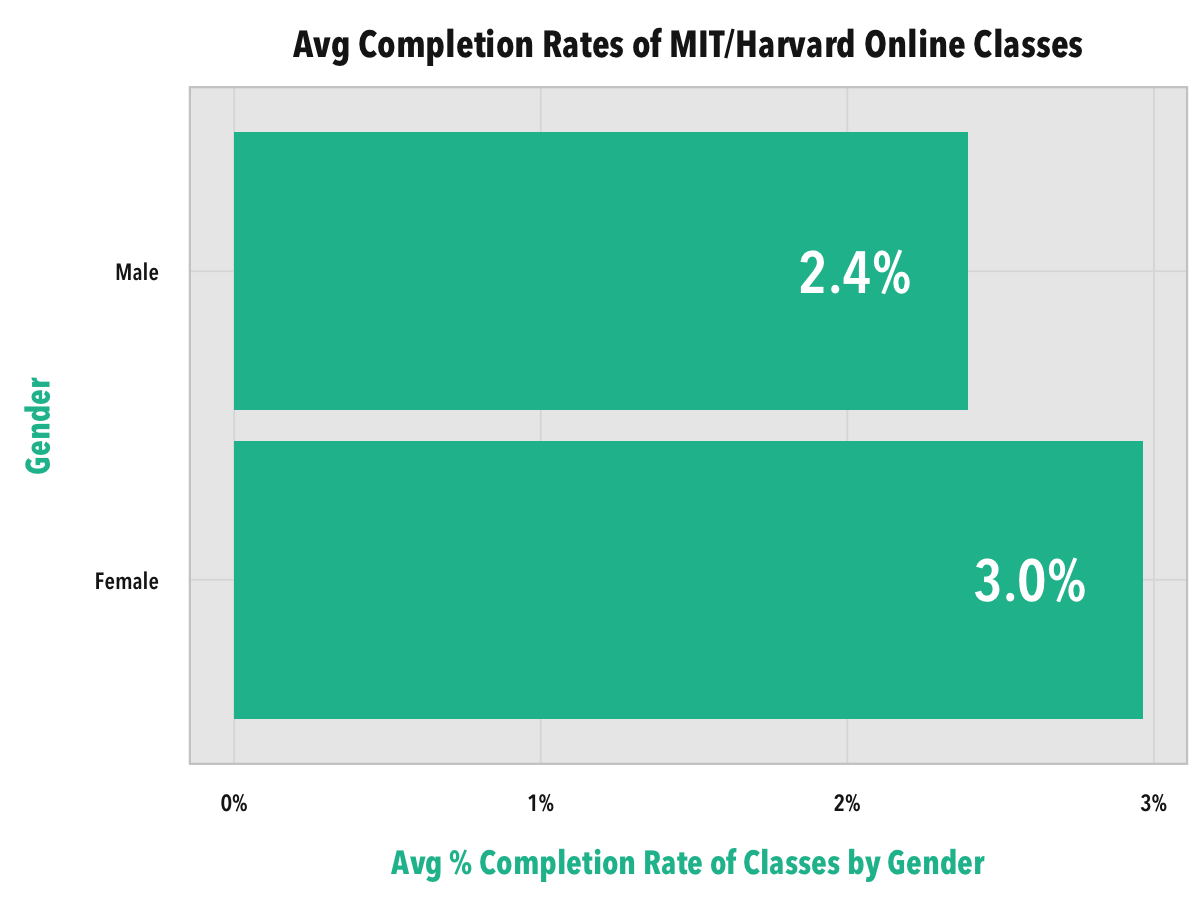
Completion rate varies a bit more. Female students finish classes more frequently than male students.
Now to answer the age-old question: who get better grades: men or women?
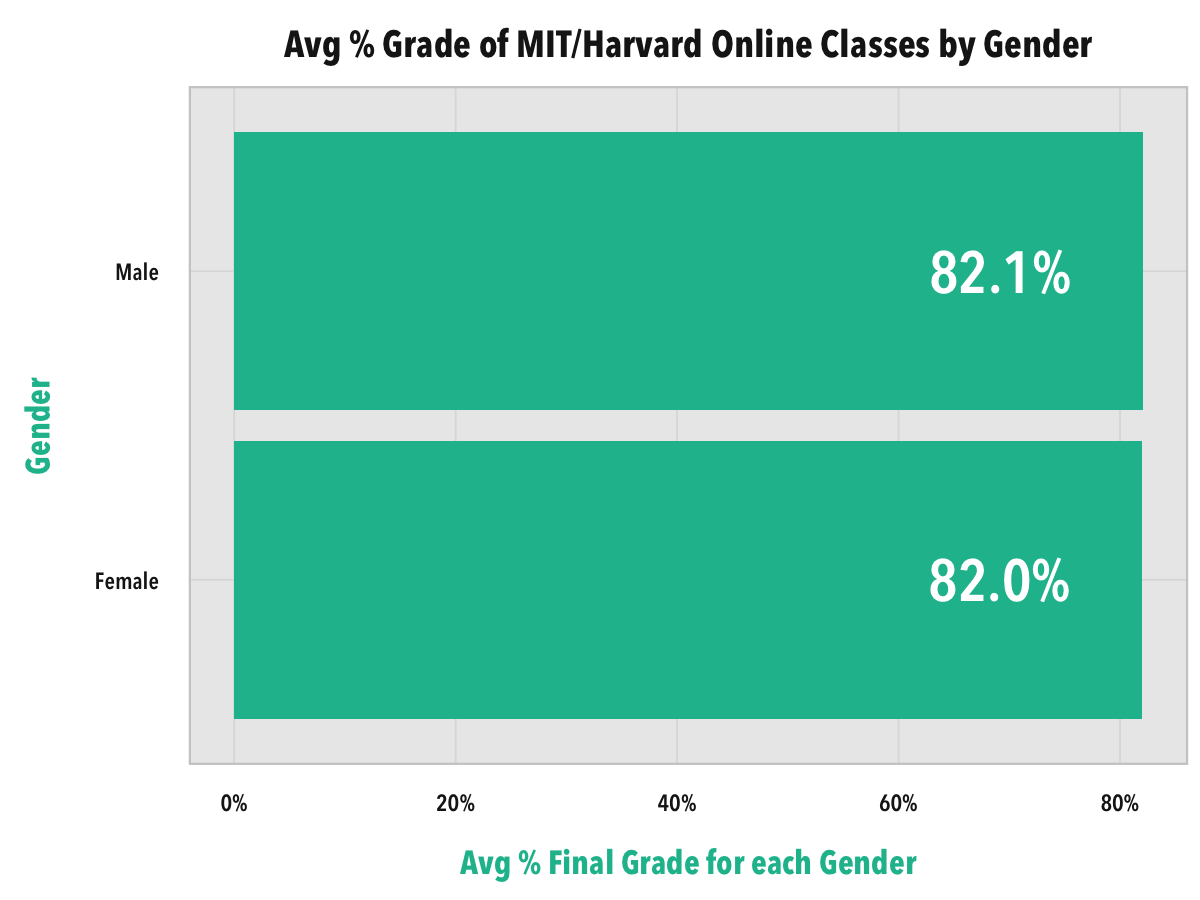
Ok, it’s a tie.
Country
The home location of the students is, in my opinion, the most interesting student attribute in the data set. There are 24 different countries which were specified among 325,012 different students.
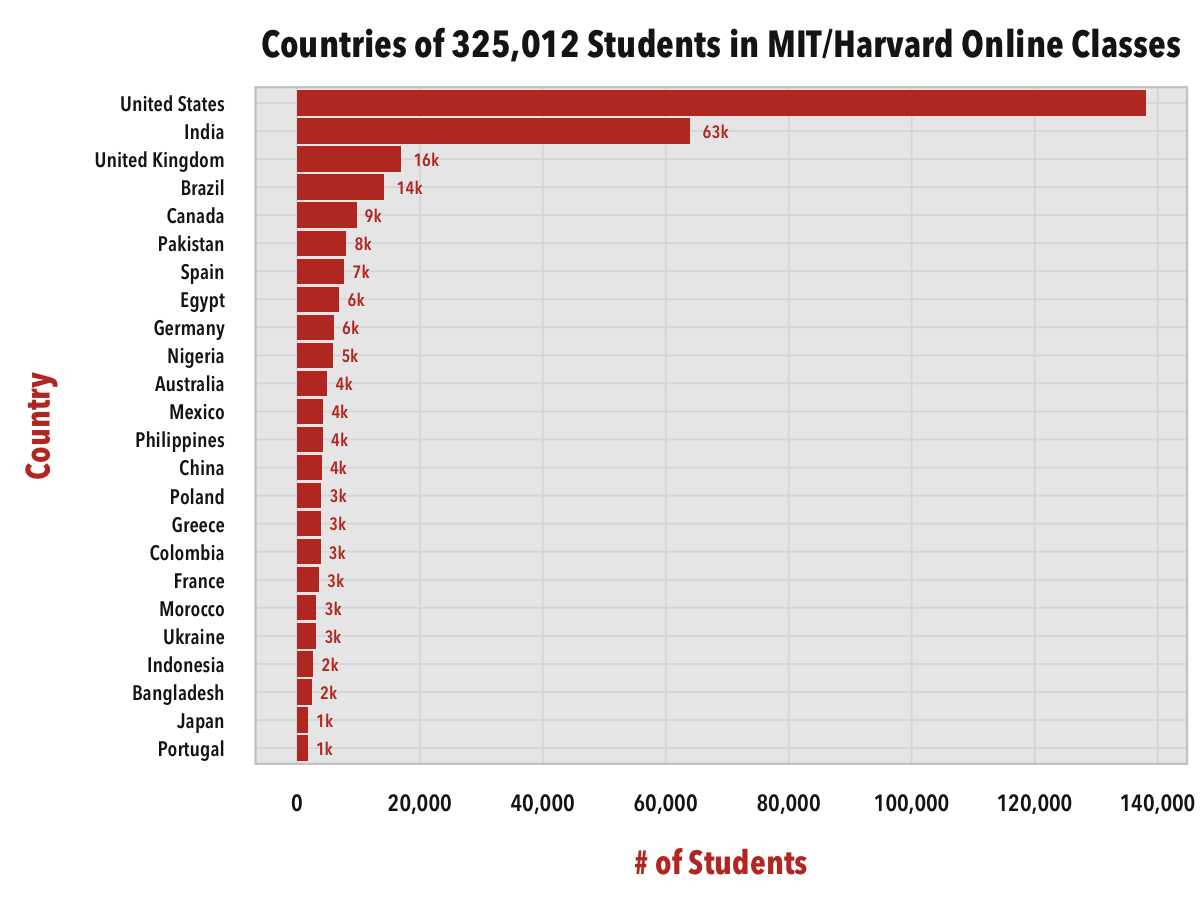
The United States, as one of the more technologically-savvy countries, accounts for nearly 1/3rd of all online students. India has a very strong presence as well due to the combination of population and accessibility of materials. All the other countries have significantly fewer students.
Given such accessibility of online classes, students in some countries take more classes than others.
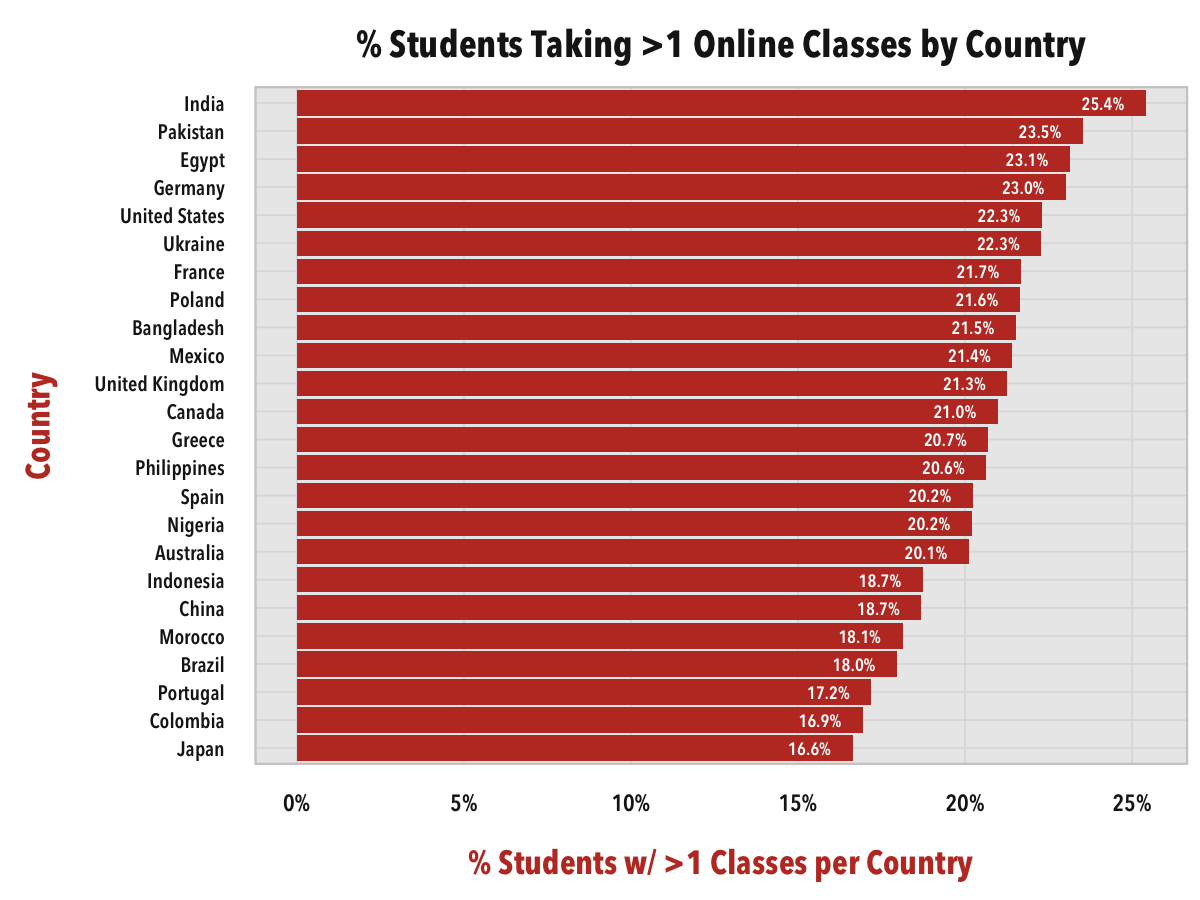
India’s students also take the most classes on average.
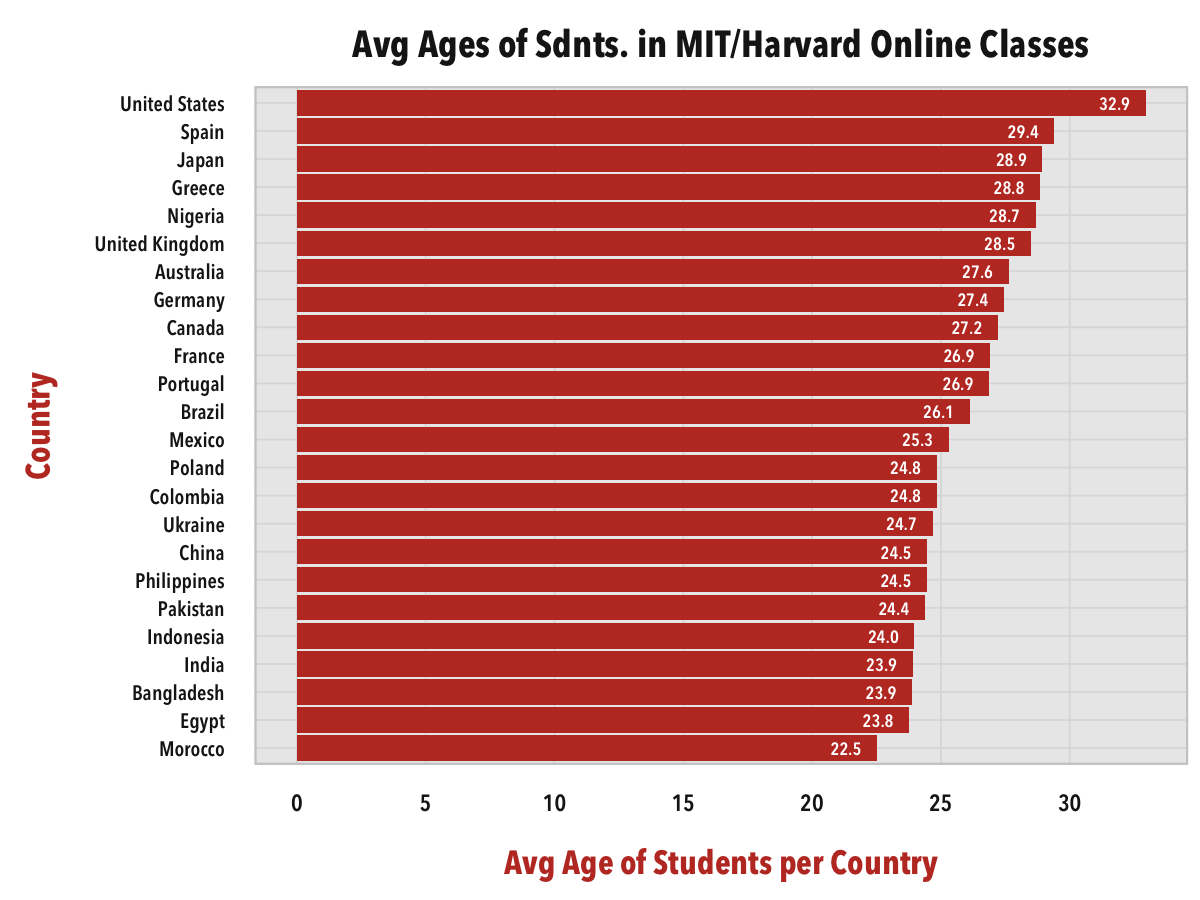
The United States also has the oldest students on average among all the countries.
Completion rate by country, however, is very, very significant.
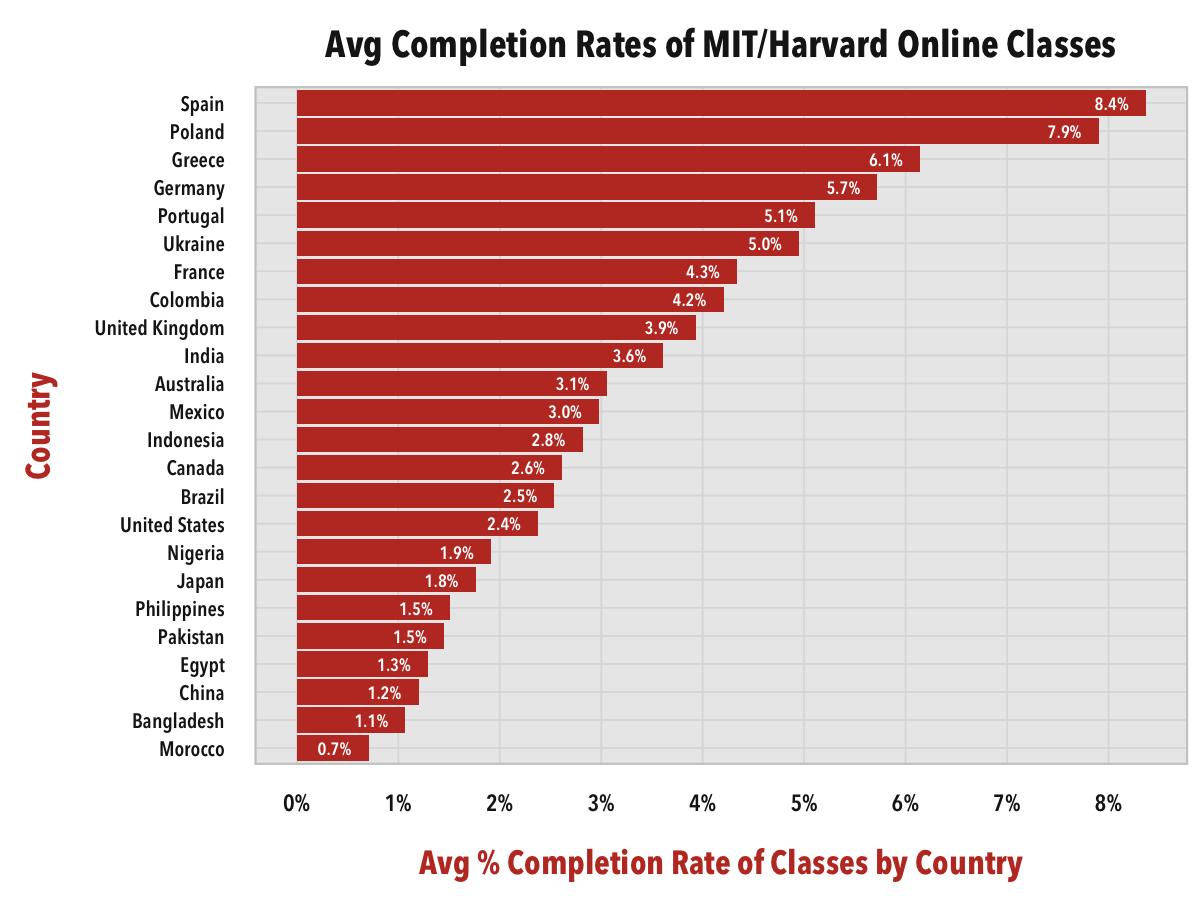
The top seven countries with the highest rate of completion are all European countries, with Spain and Poland in particular having a higher rate of completion than all the other countries, and nearly four times the completion rate of the United States.
But which country has the students which get the best grades?
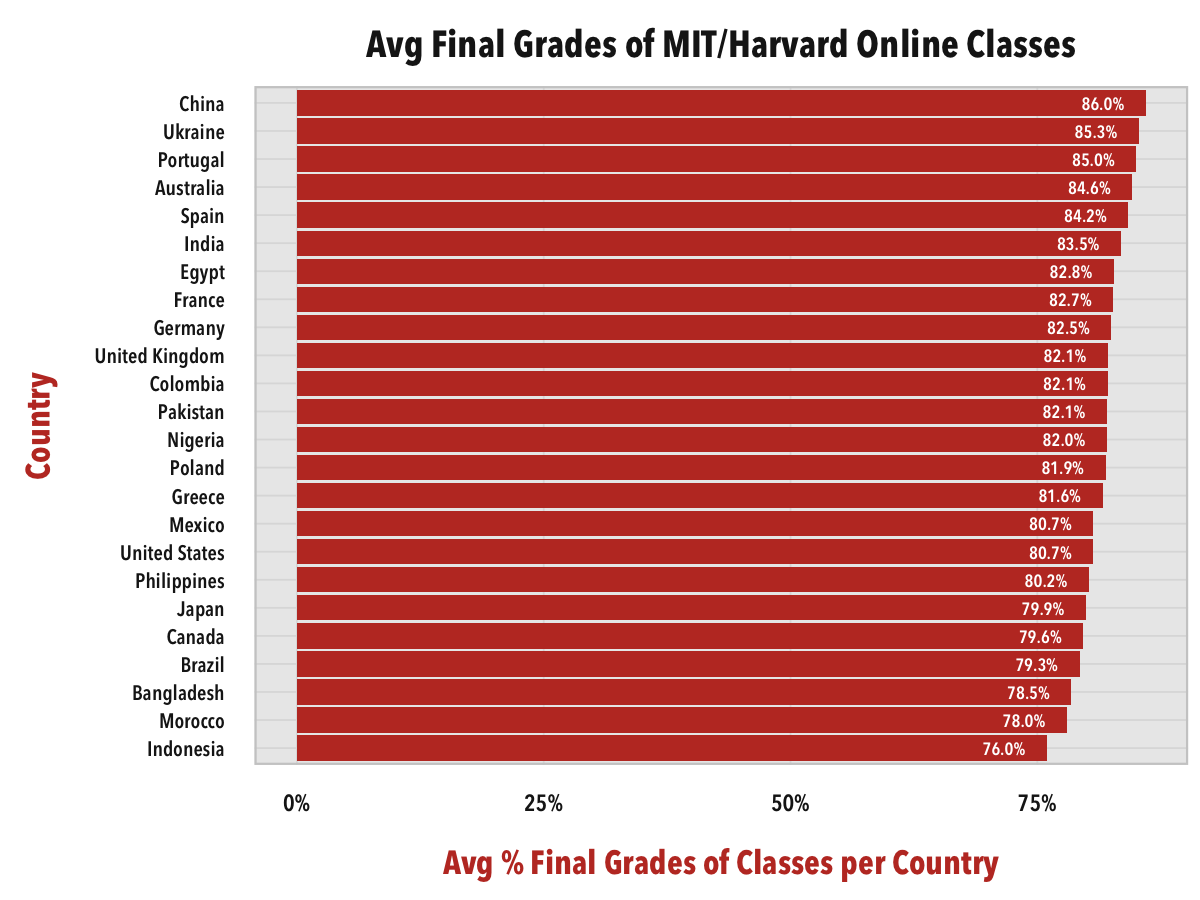
China is at the top with 86%, but otherwise the distribution is fairly flat with no outliers, and no economic or demographical pattern to the top or bottom of the ranks. It’s possible that the more structured format of the classes make it harder to skew.
This Person-Course dataset has helped reveal many interesting insights about online classes at Harvard and MIT. Whether you measure performance by % of classes completed or a % score received at the end of the class, it’s clear that age, country, and level of education all have a statistically significant impact on performance. The impact of the student’s gender on performance, however, is more ambiguous and could use further analysis.
- Data was processed using R and all charts were made using ggplot2.
- You can view code necessary to reproduce these results AND reproduce all the charts in this GitHub repository. Since MIT/Harvard prevent redistribution of the dataset, you’ll have to download the dataset yourself.
