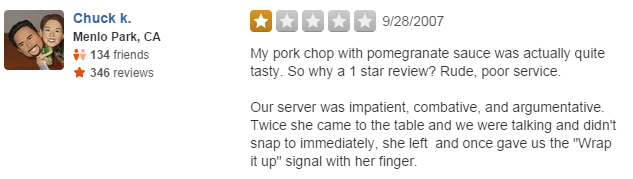
Many business in the real world encourage their customers to “Rate us on Yelp!”. Yelp, the “best way to find local businesses,” relies on user reviews to help its viewers find the best places. Both positive and negative reviews are helpful in this mission: positive reviews on Yelp identify the best places, negative reviews identify places where people shouldn’t go. Usually, both positive and negative reviews are not based on objective attributes of the business, but on the experience the writer has with the establishment.

I analyzed the language present in 1,125,458 Yelp Reviews using the dataset from the Yelp Dataset Challenge containing reviews of businesses in the cities of Phoenix, Las Vegas, Madison, Waterloo and Edinburgh. Users can rate businesses 1, 2, 3, 4, or 5 stars. When comparing the most-frequent two-word phrases between 1-star and 5-star reviews, the difference is apparent.
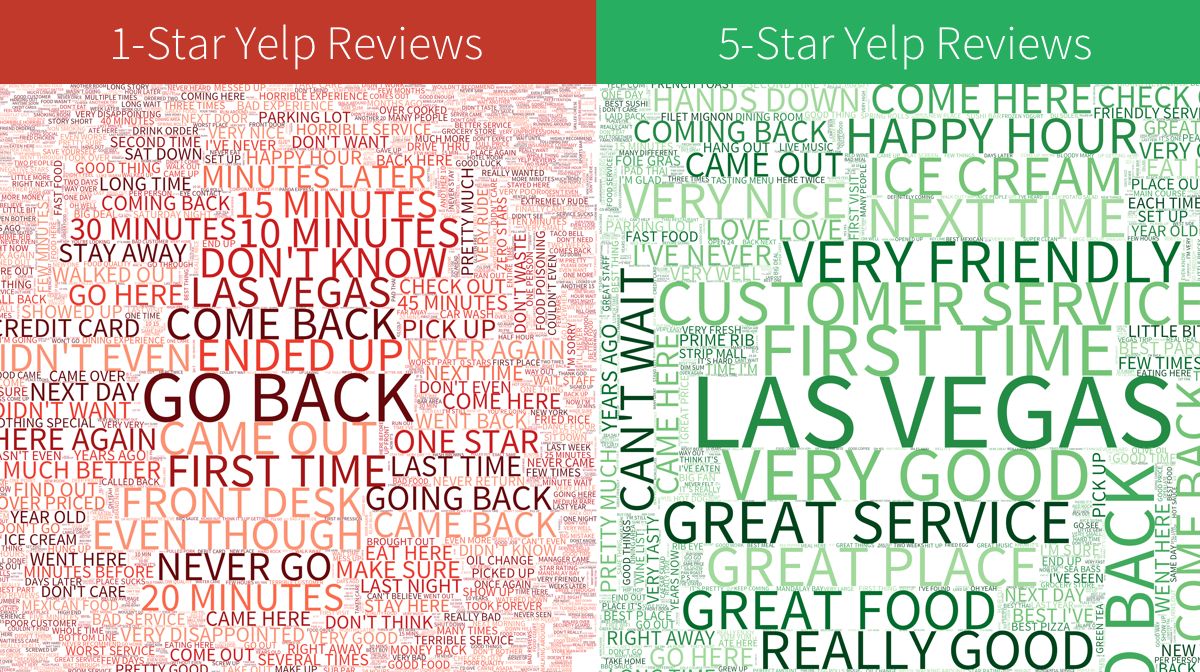
The 5-star Yelp reviews contain many instances of “Great”, “Good”, and “Happy”. In contrast, the 1-star Yelp reviews use very little positive language, and instead discuss the amount of “minutes,” presumably after long and unfortunate waits at the establishment. (Las Vegas is one of the cities where the reviews were collected, which is why it appears prominently in both 1-star and 5-star reviews)
Looking at three-word phrases tells more of a story.
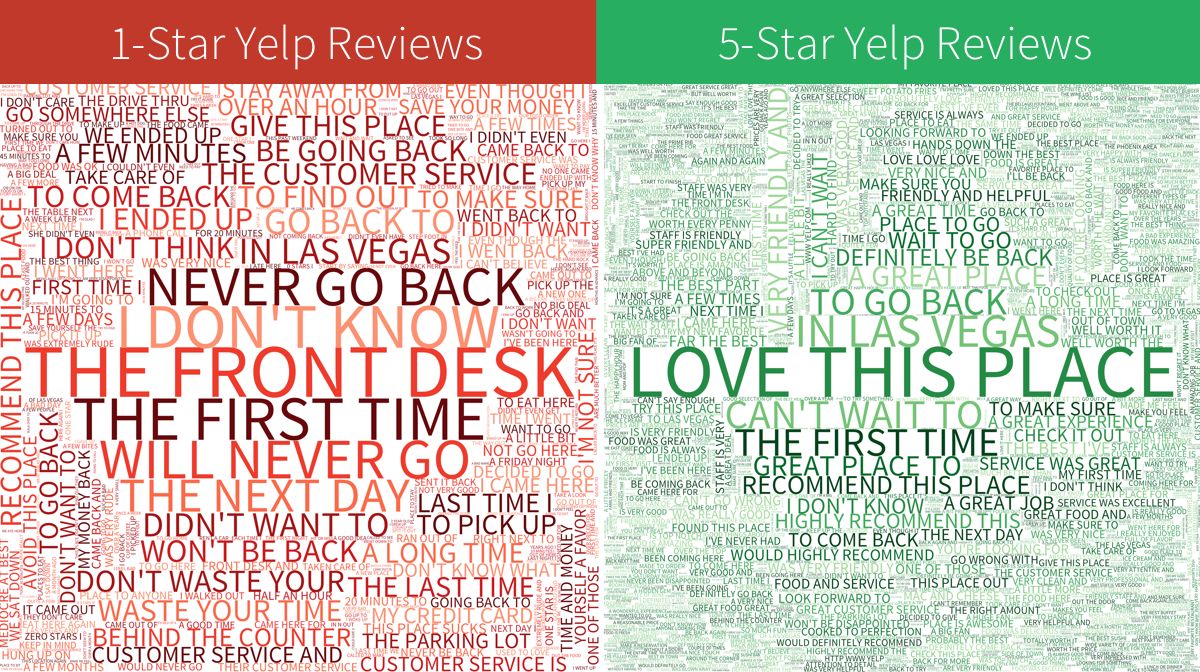
1-Star reviews frequently contain warnings for potential customers, which promises that the author will “never go back” and a strong impression that issues stem from conflicts with “the front desk”, such as those at hotels. 5-star reviews “love this place” and “can’t wait to” go back.
Can this language be used to predict reviews?
Regression of Language
To determine the causal impact on positive and negative words on the # of stars given in a review, we can perform a simple linear regression of stars on the number of positive words in the review, the number of negative words in the review, and the number of words in the review itself (since the length of the review is related to the number of positive/negative words; the longer the review, the more words)
A quick-and-dirty way to determine the number of positive/negative words in a given Yelp review is to compare each word of the review against a lexicon of positive/negative words, and count the number of review words in the lexicon. In this case, I use the lexicons compiled by UIC professor Bing Liu.
Running a regression of # stars in a Yelp review on # positive words, # negative words, and # words in review, returns these results:
Coefficients:
               Estimate	 Std. Error  t value  Pr(>|t|)
(Intercept)    3.692      1.670e-03  2210.0   <2e-16 ***
pos_words      0.122      2.976e-04   411.3   <2e-16 ***
neg_words     -0.154      4.887e-04  -315.9   <2e-16 ***
review_words  -0.003      1.984e-05  -169.4   <2e-16 ***


Residual standard error: 1.119 on 1125454 degrees of freedom
Multiple R-squared:  0.2589,	Adjusted R-squared:  0.2589
F-statistic: 1.311e+05 on 3 and 1125454 DF,  p-value: < 2.2e-16
The regression output explains these things:
- If a reviewer posted a blank review with no text in it, that review gave an average rating of 3.692.
- For every positive word, the predicted average star rating given is increased by 0.122 on average (e.g. 8 positive words indicate a 1-star increase)
- For every negative word, the predicted average star rating given is decreased by 0.15 on average (e.g. 6-7 negative words indicate a 1-star decrease)
- The amount of words in the review has a lesser, negative effect. (A review that is 333 words indicates a 1-star decrease, but the average amount of words in a Yelp review is 130 words)
- This model explains 25.98% of the variation in the number of stars given in a review. This sounds like a low percentage, but is impressive for such a simple model using unstructured real-world data.
All of these conclusions are extremely statistically significant due to the large sample size.
Additionally, you could rephrase the regression as a logistic classification problem, where reviews rated 1, 2, or 3 stars are classified as “negative,” and reviews with 4 or 5 stars are classified as “positive.” Then, run the regression to determine the likelihood of a given review being positive. Running this regression (not shown) results in a logistic model with up to 75% accuracy, a noted improvement over the “no information rate” of 66%, which is the model accuracy if you just guessed that every review was positive. The logistic model also has similar conclusions for the predictor variables as the linear model.
It can be proven that language has a strong statistical effect on review ratings, but that’s intuitive enough. How have review ratings changed?
1-Star and 5-Star Reviews, Visualized
Since 2005, Yelp has had incredible growth in the number of new reviews.
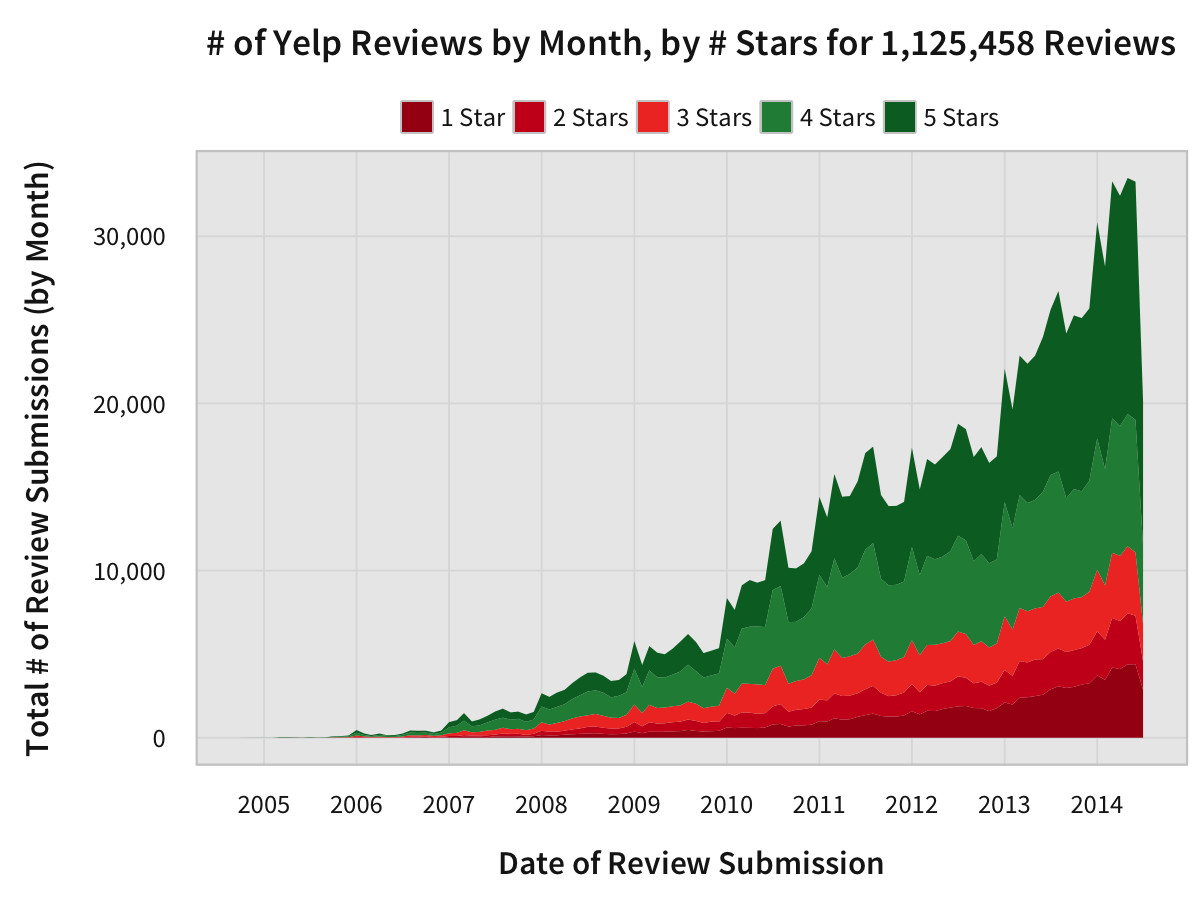
For that chart, it appears that each of the five rating brackets have grown at the same rate, but that isn’t the case. Here’s a chart of the rating brackets showing how the proportions of new reviews of each rating have changed over time.
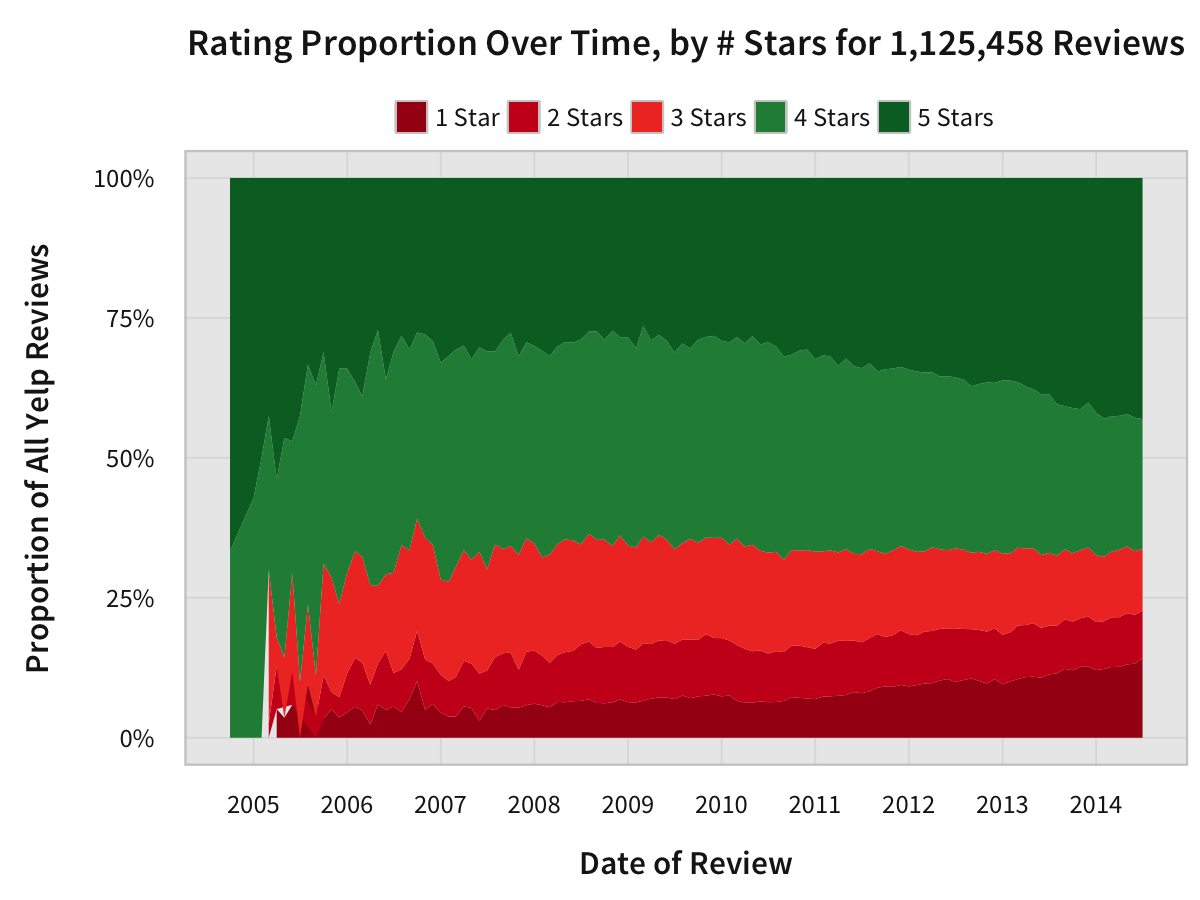
Early Yelp had mostly 4-star and 5-star reviews, as one might expect for an early Web 2.0 startup where the primary users who would be the only ones who would put in the effort to write a review would be those who had positive experiences. However, the behavior from 2010 onward is interesting: the relative proportions of both 1-star reviews and 5-star reviews increases over time.
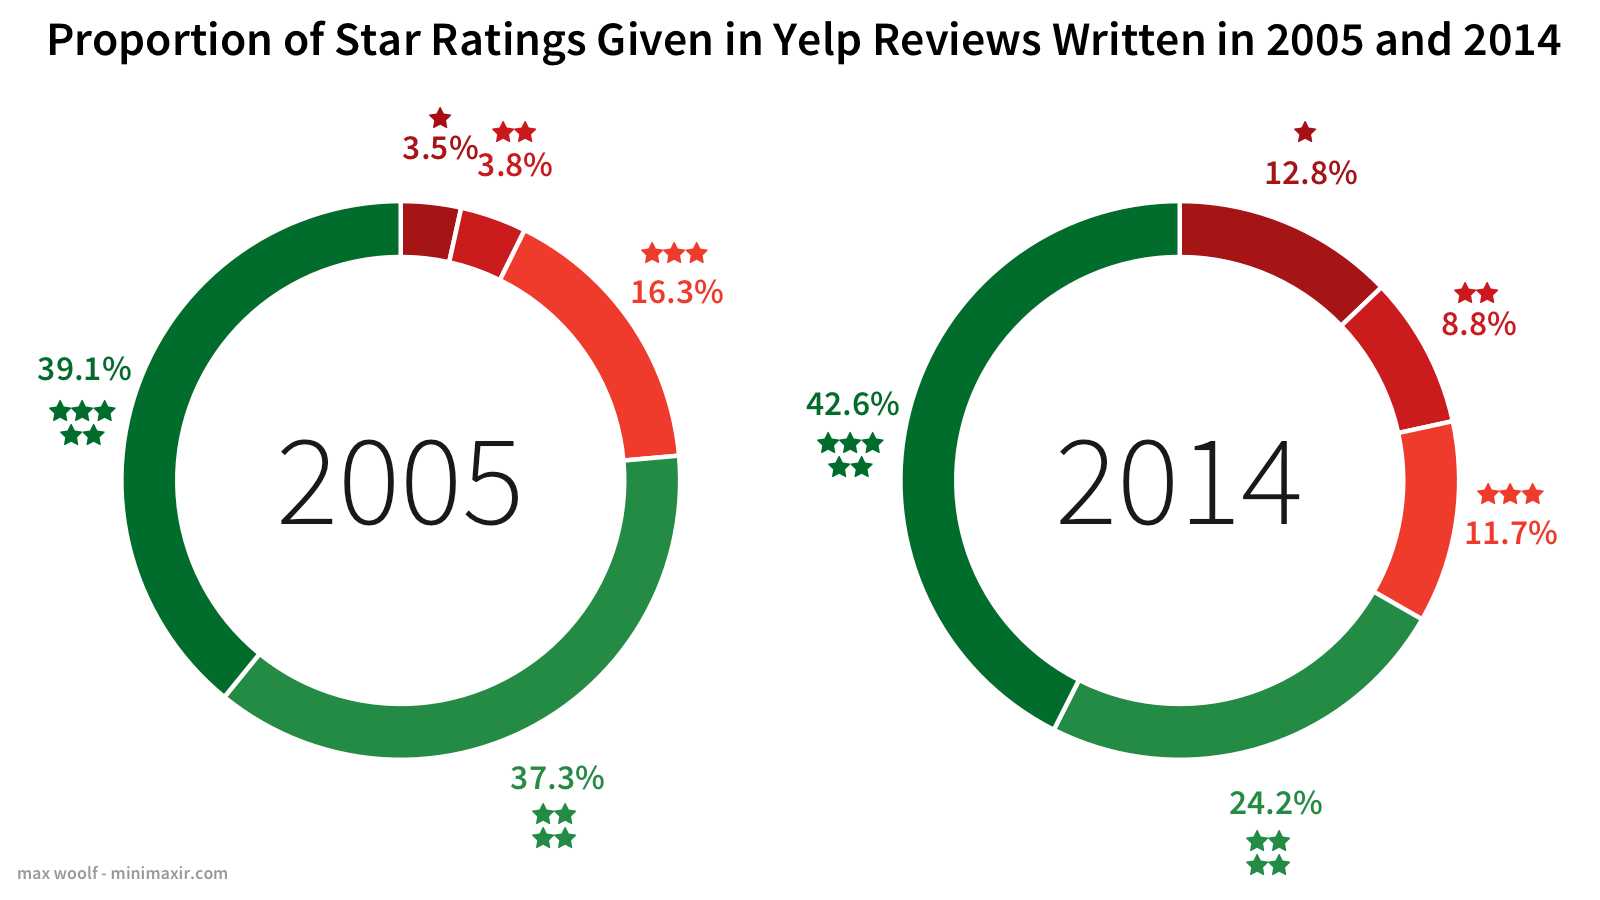
As a result, the proportions of ratings in reviews from Yelp’s beginning in 2005 and Yelp’s present 2014 are incredibly different.
More negativity, more positivity. Do they cancel out?
How Positive Are Yelp Reviews?
We can calculate relative positivity between reviews by taking the number of positive reviews in a review and dividing it by the number of words in the review itself.
The average positivity among all reviews is 5.6%. Over time, the positivity has been relatively flat.
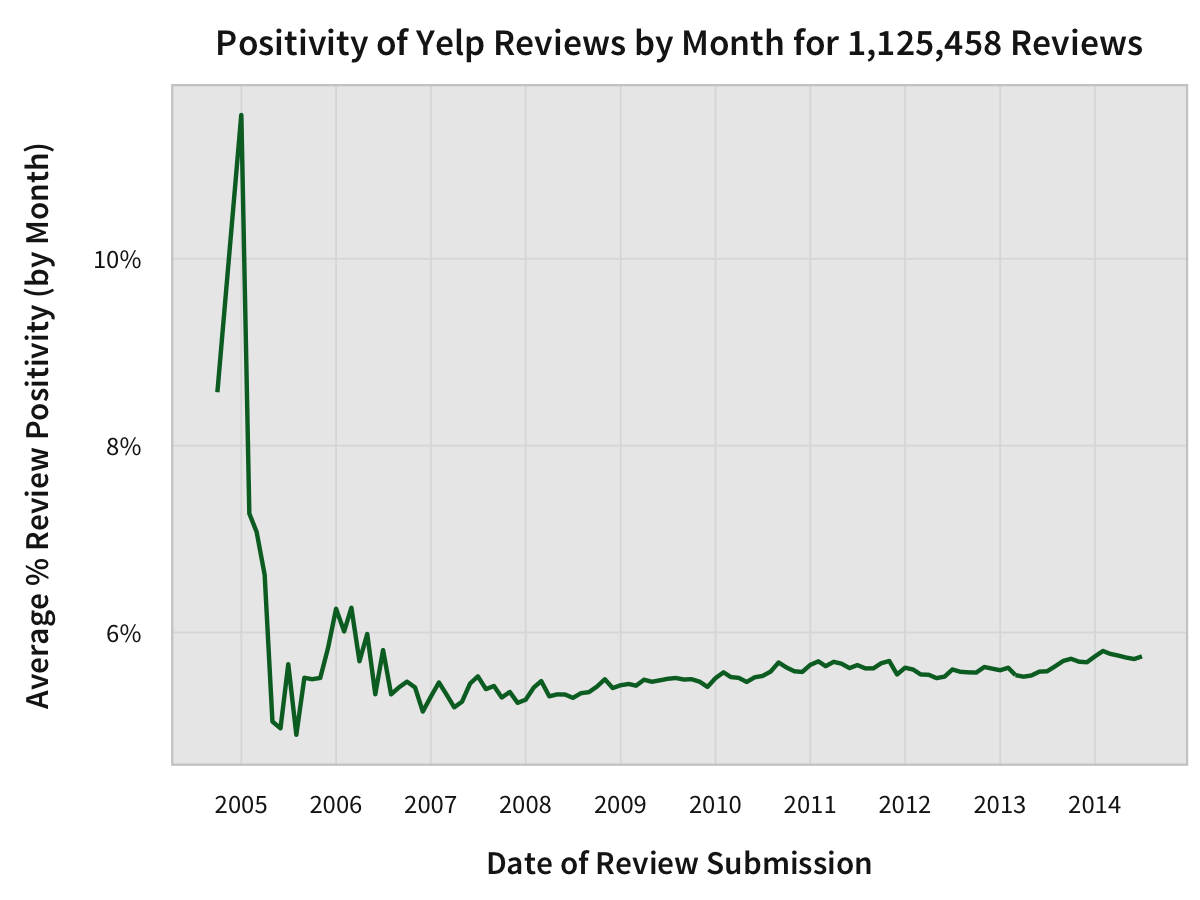
Flat, but still increasing, mostly likely due to the increasing proportion of 5-star reviews. But the number of 1-star reviews also increased: do the two offset each other?
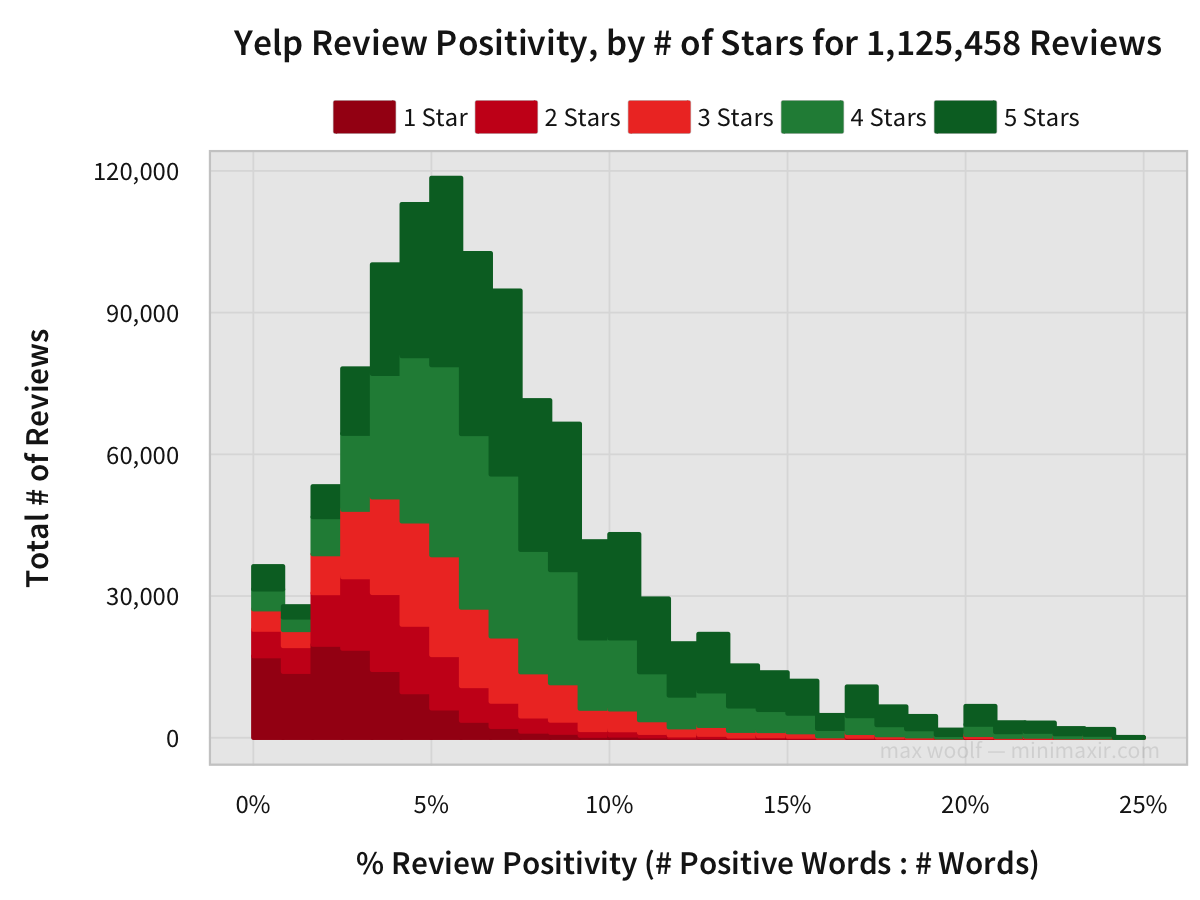
This histogram of positivity scores shows that 1-star reviews have lower positivity with rarely high positivity, and 5-star reviews rarely have low positivity and instead have very high positivity. The distribution for each star rating is close to a Normal distribution, with each successive rating category peaking at increasing positivity values.
The relative proportion of each star rating reinforces this.
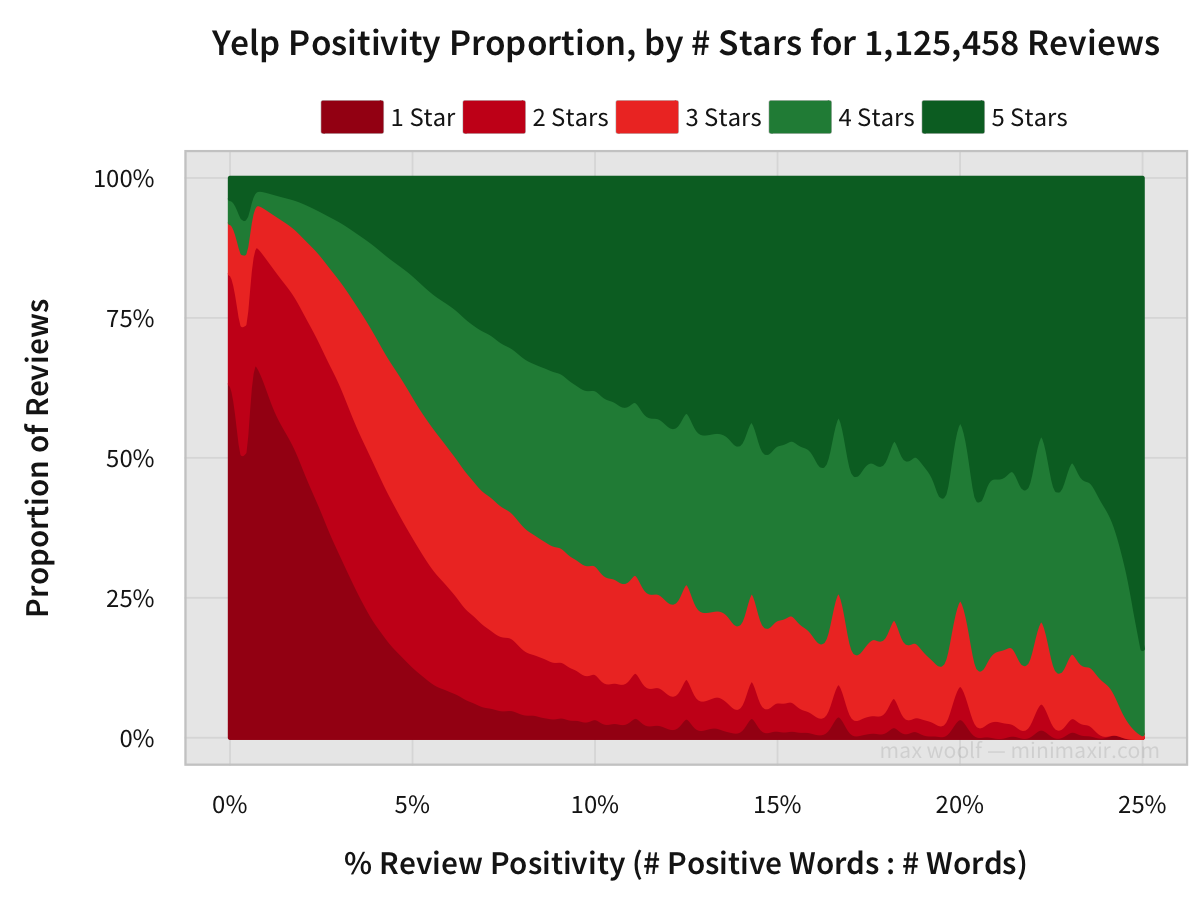
Over half of the 0% positivity reviews are 1-star reviews, while over three-quarters of the reviews at the highest positivity levels are 5-star reviews. (note that the 2-star, 3-star, and 4-star ratings are not as significant at either extreme)
How Negative Are Yelp Reviews?
When working with the negativity of reviews, calculated by taking the number of negative words and dividing them by the number of total words in the review, the chart looks much different.
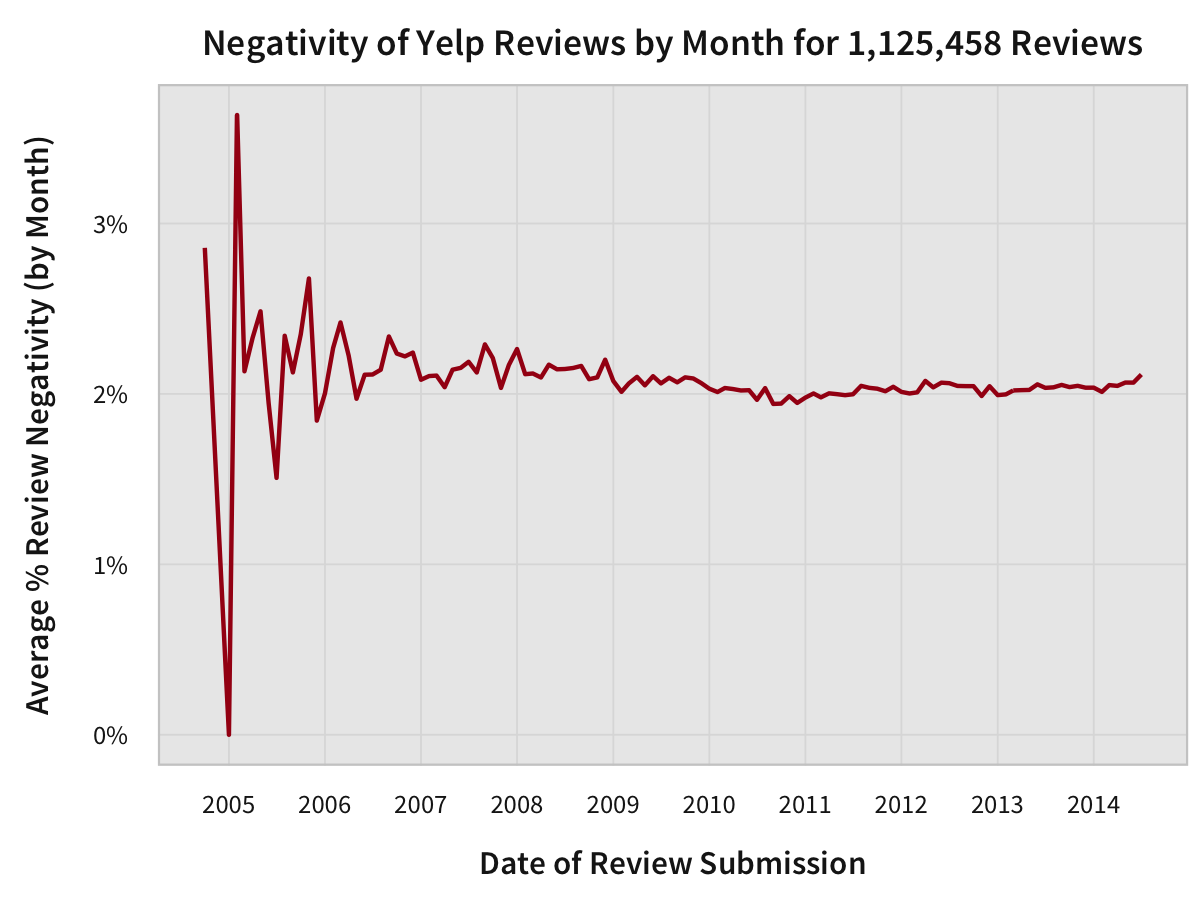
The average negativity among all reviews is 2.0%. Since the average positivity is 5.6%, this implies that the net sentiment among all reviews is positive, despite the increase in 1-star reviews over time.
The histogram of negative reviews looks much different as well.
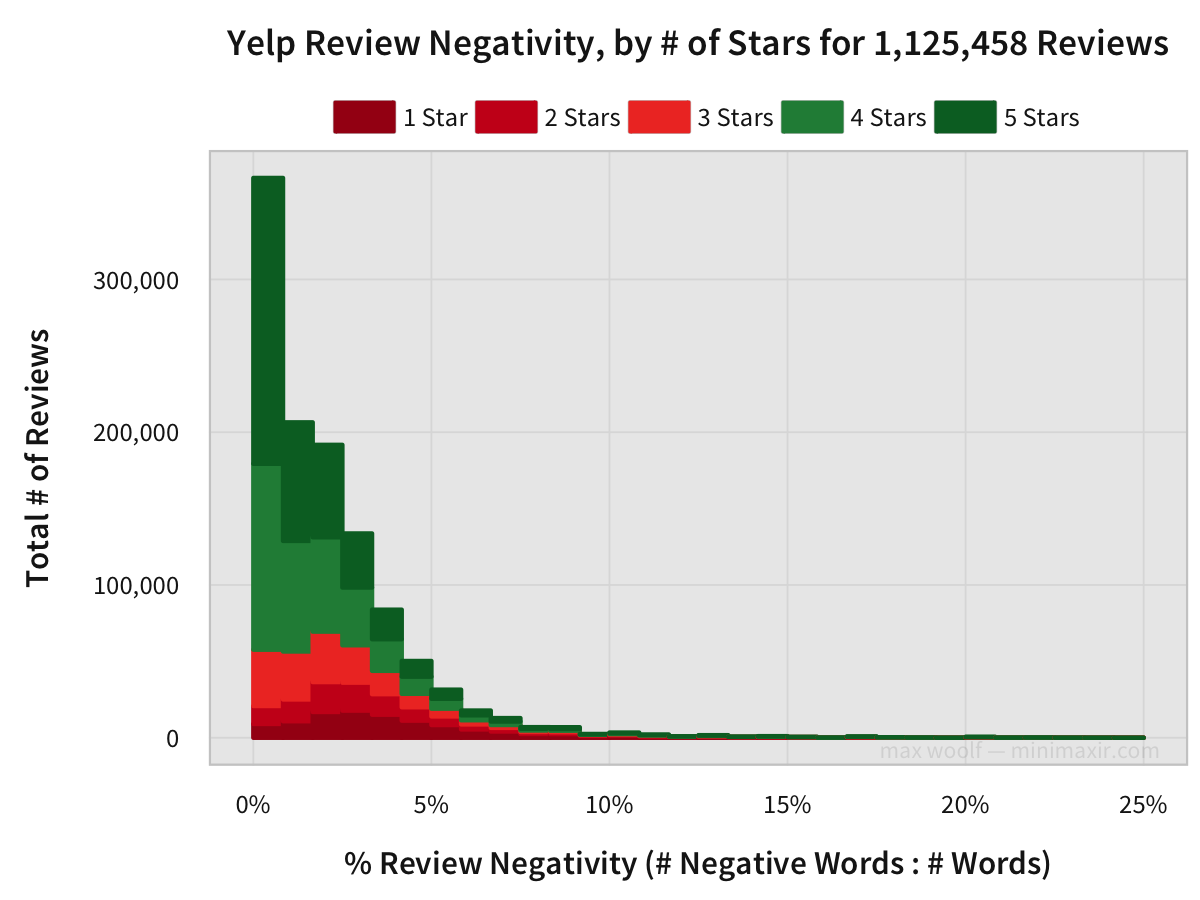
Even 1-star reviews aren’t completely negative all the time.
The chart is heavily skewed right, making it difficult to determine the proportions of each rating at first glance.
Henceforth here’s another proportion chart.
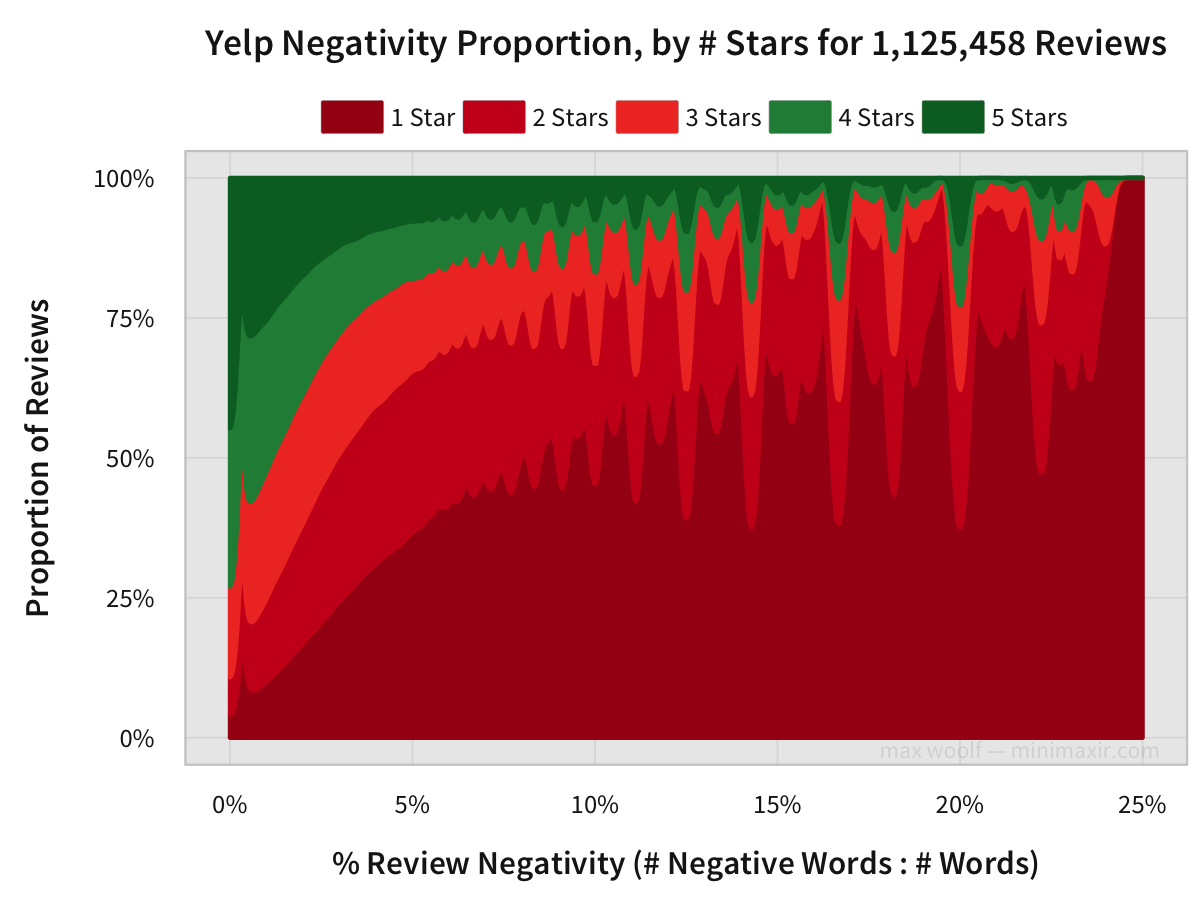
At low negativity, the proportions of negative review scores (1-star, 2-stars, 3-stars) and positive review scores (4-stars, 5-stars) are about equal, implying that negative reviews can be just as civil as positive reviews. But high negativity is solely present in 1-star and 2-star reviews.
From this article, you’ve seen that Yelp reviews with 5-star ratings are generally positive, and Yelp reviews with 1-star are generally negative. Yes, this blog post is essentially “Pretty Charts Made By Captain Obvious,” but what’s important is confirmation of these assumptions. Language plays a huge role in determining the ratings of reviews, and that knowledge could be applied to many other industries and review websites.
Four Stars
I’d give this blog post a solid 4-stars. The content was great, but the length was long, although not as long as some others. Can’t wait to read this post again!
- Yelp reviews were preprocessed with Python, by simultaneously converting the data from JSON to a tabular structure, tokenizing the words in the review, counting the positive/negative words, and storing bigrams and trigrams in a dictionary to later be exported for creaitng word clouds.
- All data analysis was performed using R, and a ll charts were made using ggplot2. Pixelmator was used to manually add relevant annotations when necessary.
- You can view both the Python and R code used to process and chart the data in this GitHub repository. Note that since Yelp prevents redistribution of the data, the code may not be reproducible.
- You can download full-resolution PNGs of the two word clouds [5000x2000px] in this ZIP file [18 MB]
