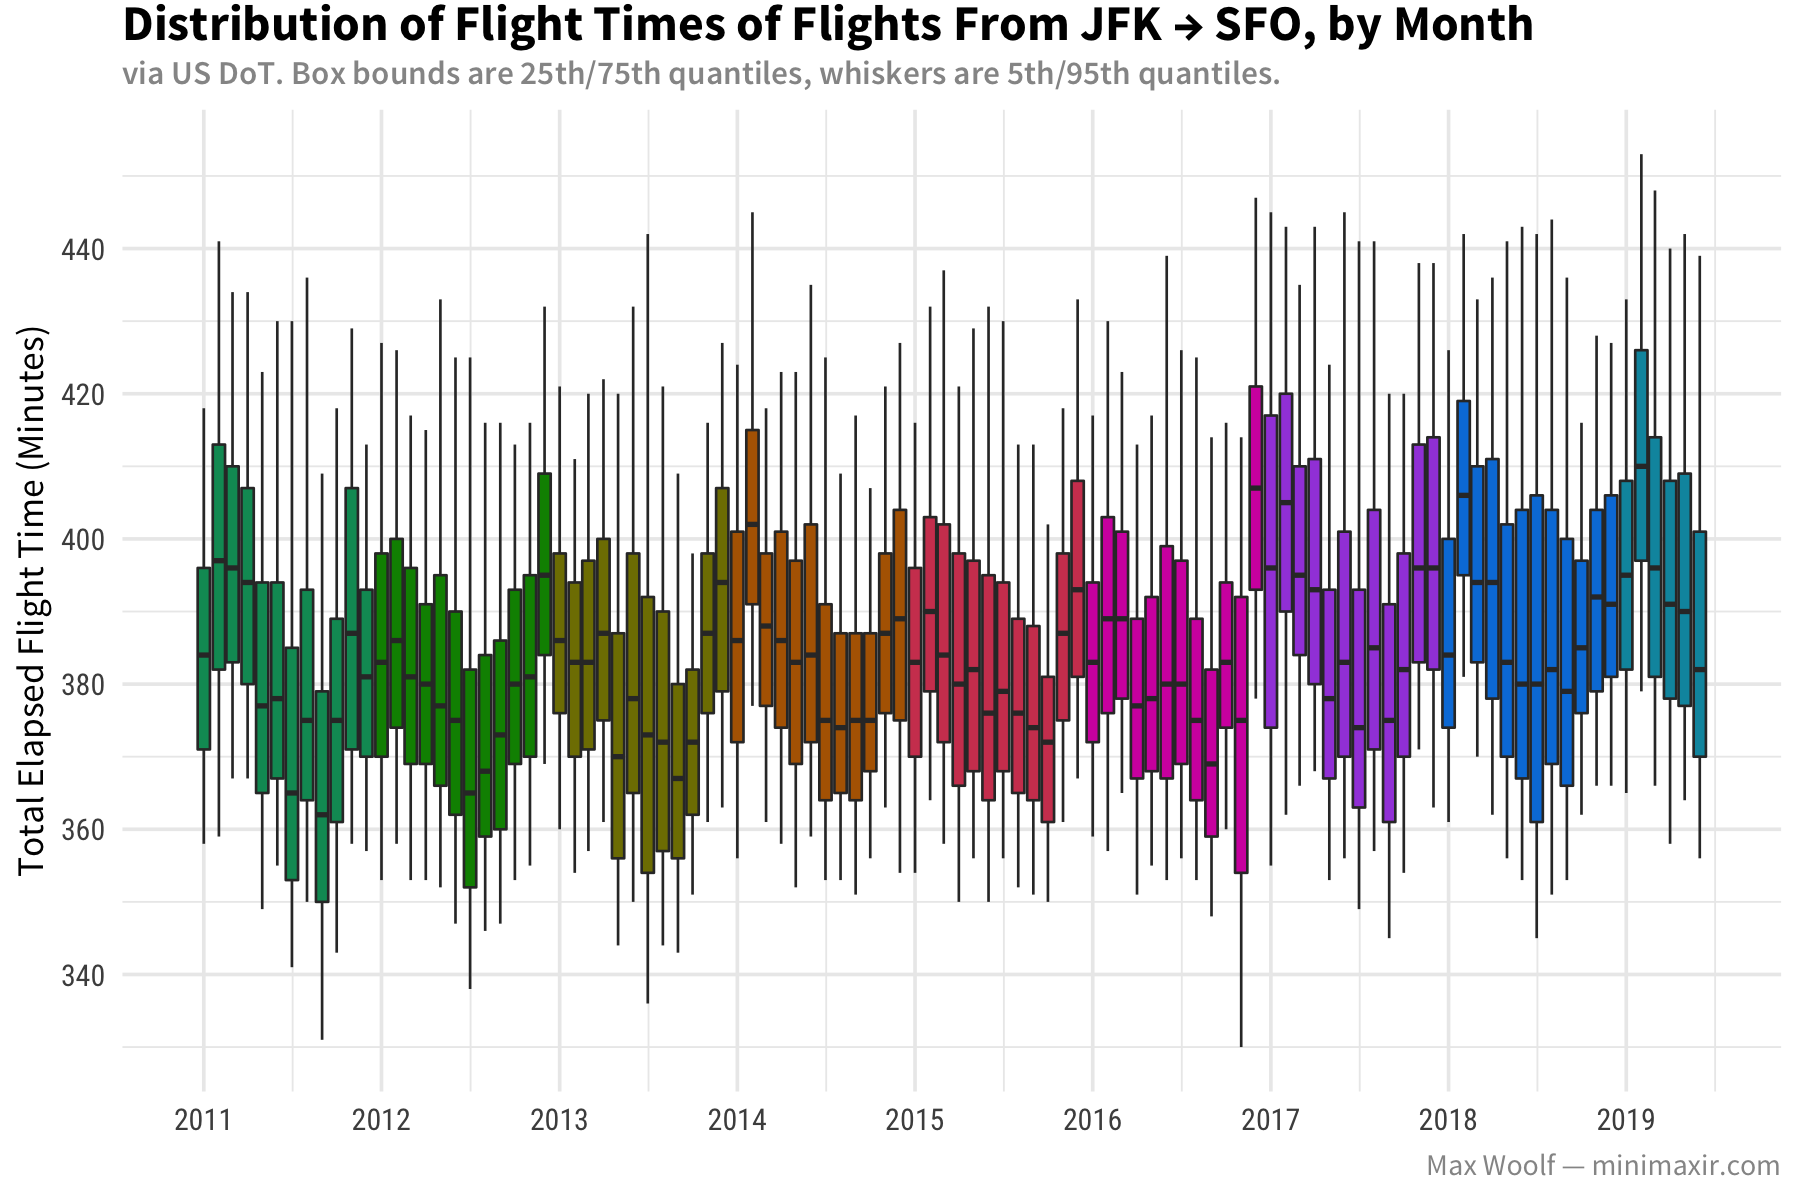
Visualizing Airline Flight Characteristics Between SFO and JFK
Box plots, when used correctly, can be a very fun way to visualize big data.
Box plots, when used correctly, can be a very fun way to visualize big data.
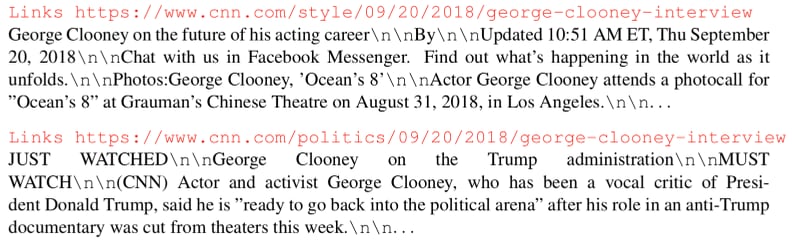
Can the CTRL model create the “fake news” OpenAI was concerned about? Let’s put it to the test.
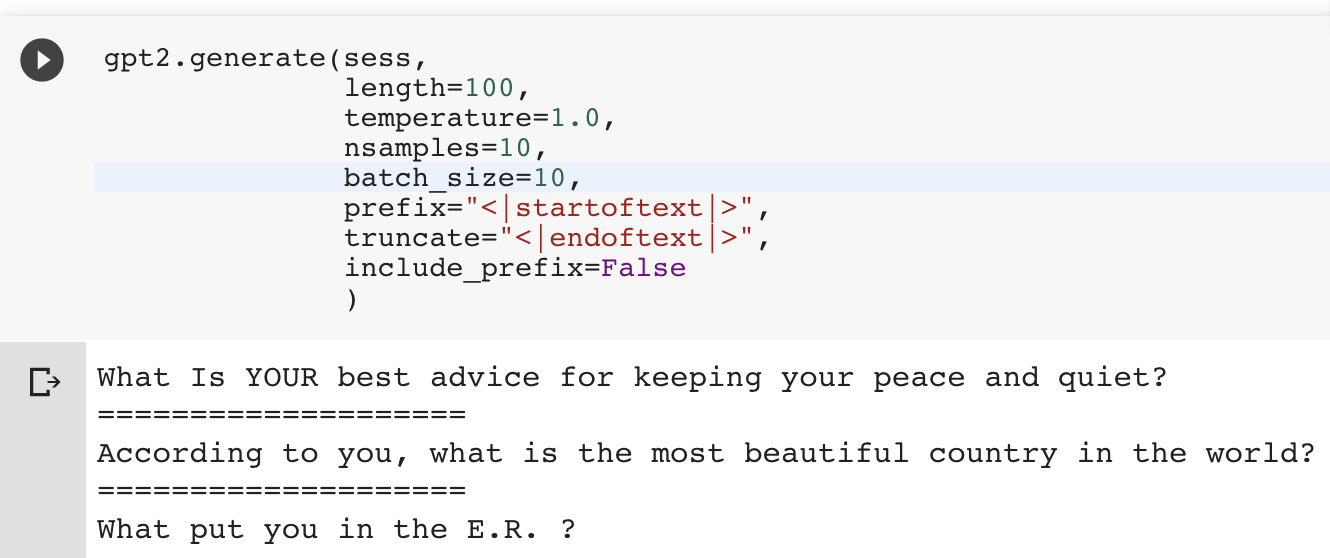
Thanks to gpt-2-simple and this Colaboratory Notebook, you can easily finetune GPT-2 on your own dataset!
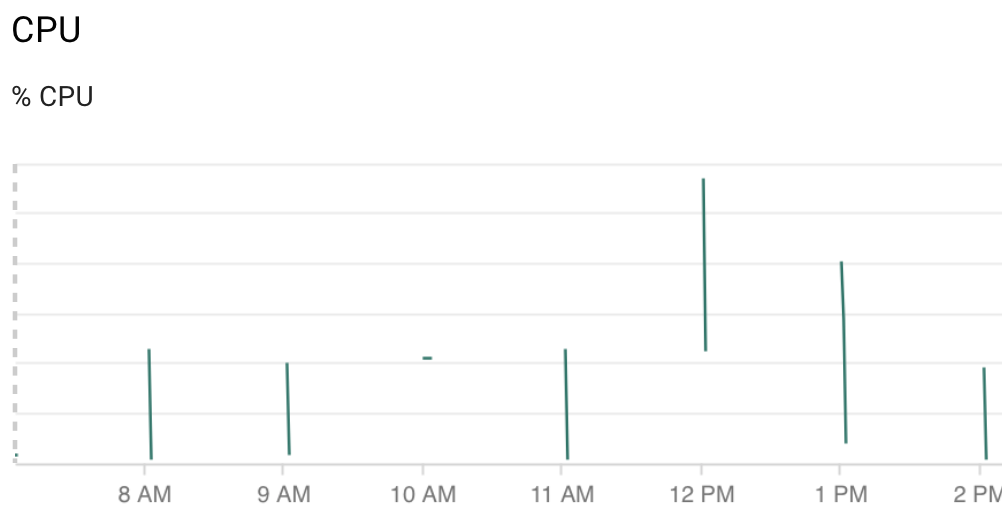
Thanks to a few new synergies within GCP products, it’s possible to get the cost of running a scheduled task down to less than a dollar a month.
MOOCs and thought pieces overfit to a certain style of data science that is not robust to the vast uncertainties of the real world.