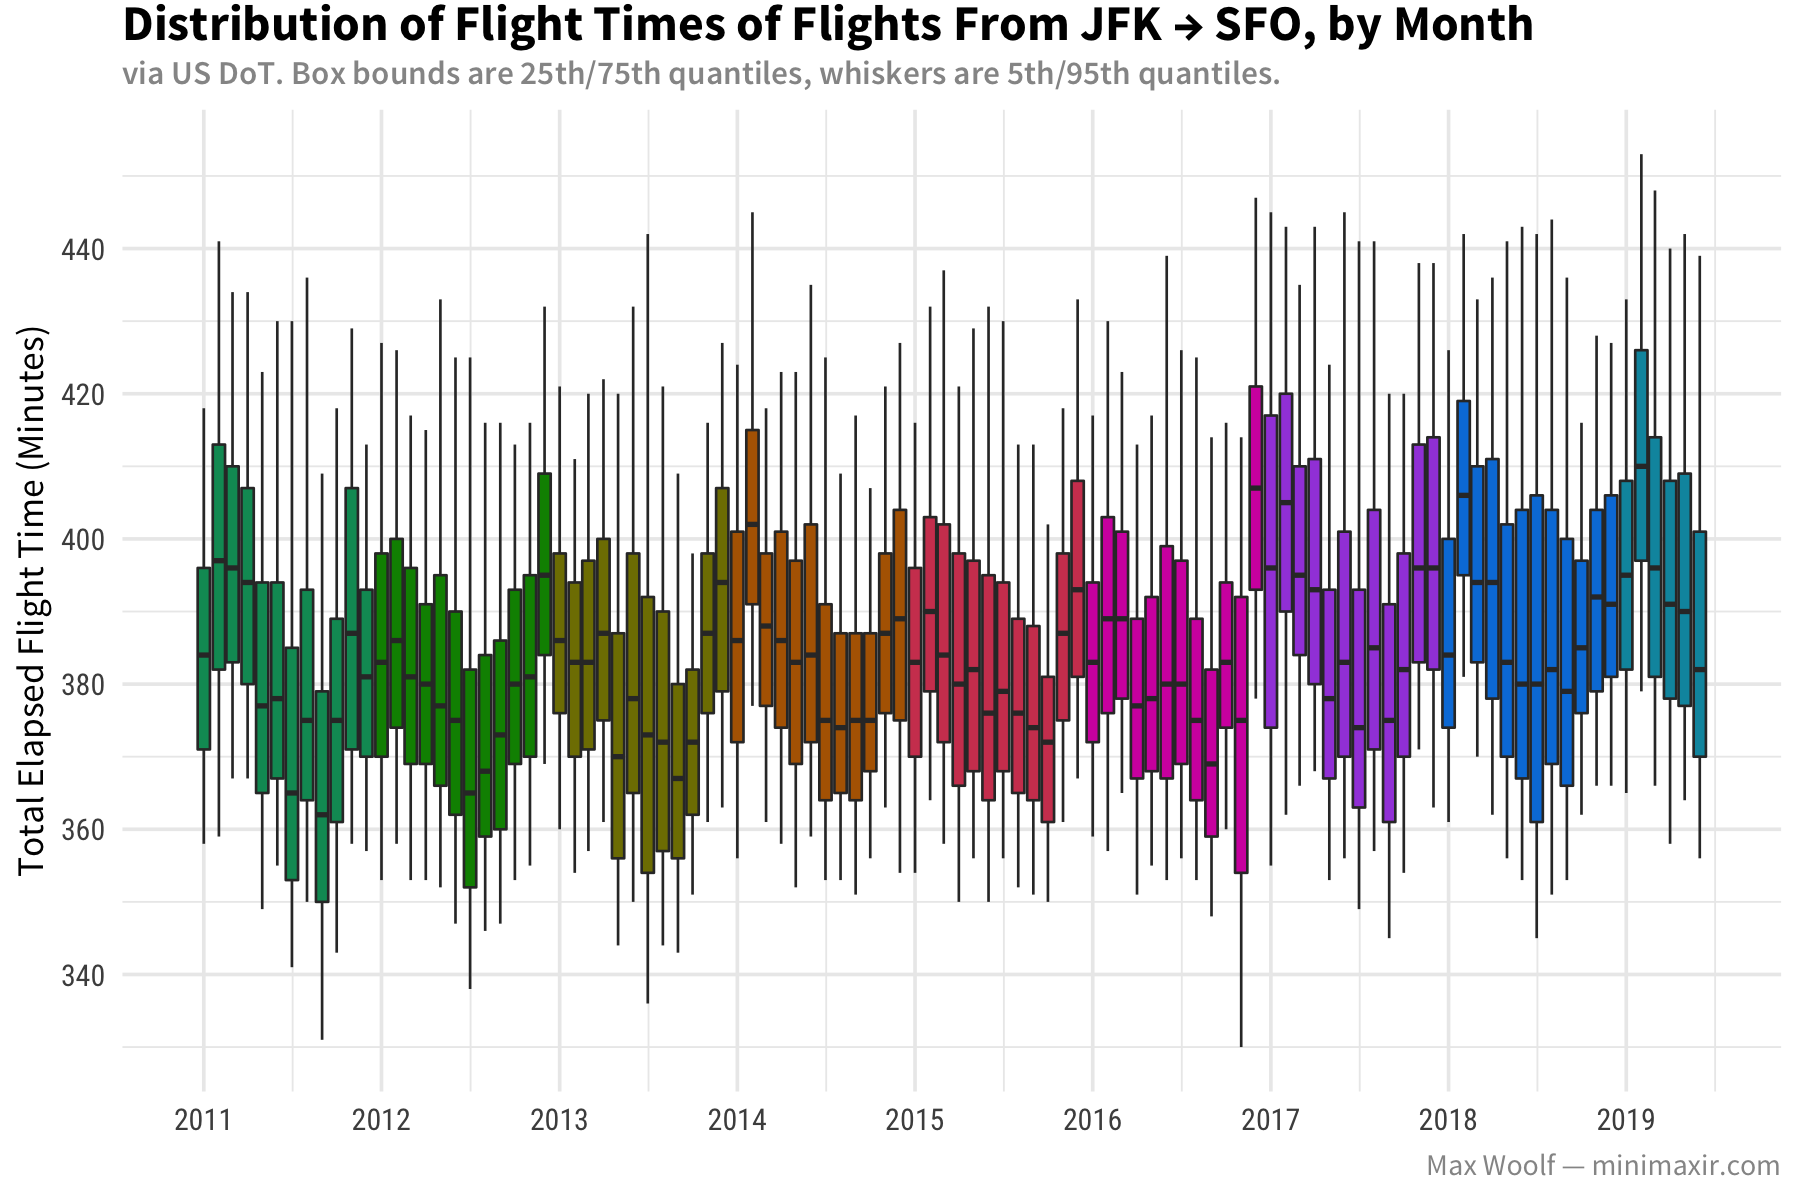
Visualizing Airline Flight Characteristics Between SFO and JFK
Box plots, when used correctly, can be a very fun way to visualize big data.
Box plots, when used correctly, can be a very fun way to visualize big data.
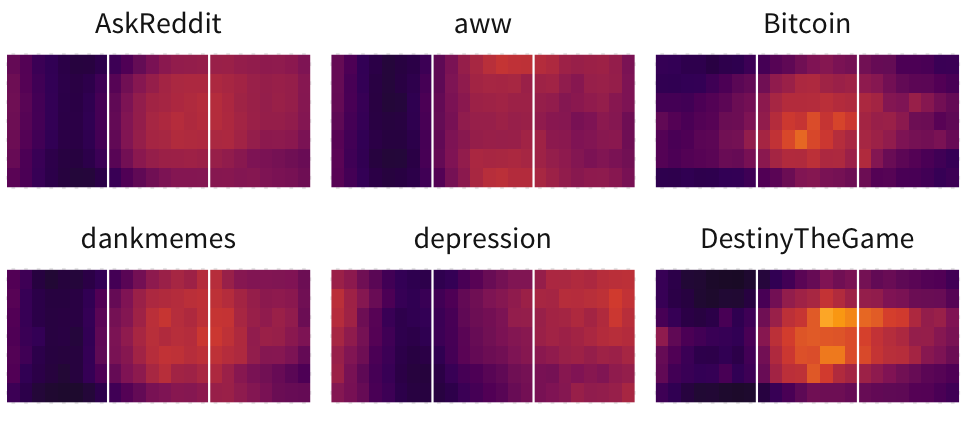
The nature of algorithmic feeds like Reddit inherently leads to a survivorship bias: although users may recognize certain types of posts that appear on the front page, there are many more which follow the same patterns but fail.
For IMDb’s big-but-not-big data, you have to play with the data smartly, and both R and ggplot2 have neat tricks to do just that.
Although visualizing basketball shots has been done before, this time we have access to an order of magnitude more public data to do some really cool stuff.
Manipulating actually-big-data is just as easy as performing an analysis on a dataset with only a few records.