Stack Overflow is the most popular contemporary knowledge base for programming questions. But most interact with the site by Googling a programming question and getting a top result that links to SO. There isn’t as much discussion about actually asking questions on the site.
I could use my Stack Overflow account and test out the process of creating a question, but I already know everything about programming there may be another way to learn how SO works. Stack Overflow releases an archive of all questions on the site every 3 months, and this archive is syndicated to BigQuery, making it trivial to retrieve and analyze the millions of SO questions over the years. Even though (now-former) Stack Overflow data scientist David Robinson has written many interesting blog posts for Stack Overflow with their data, I figured why not give it a try.
Overview
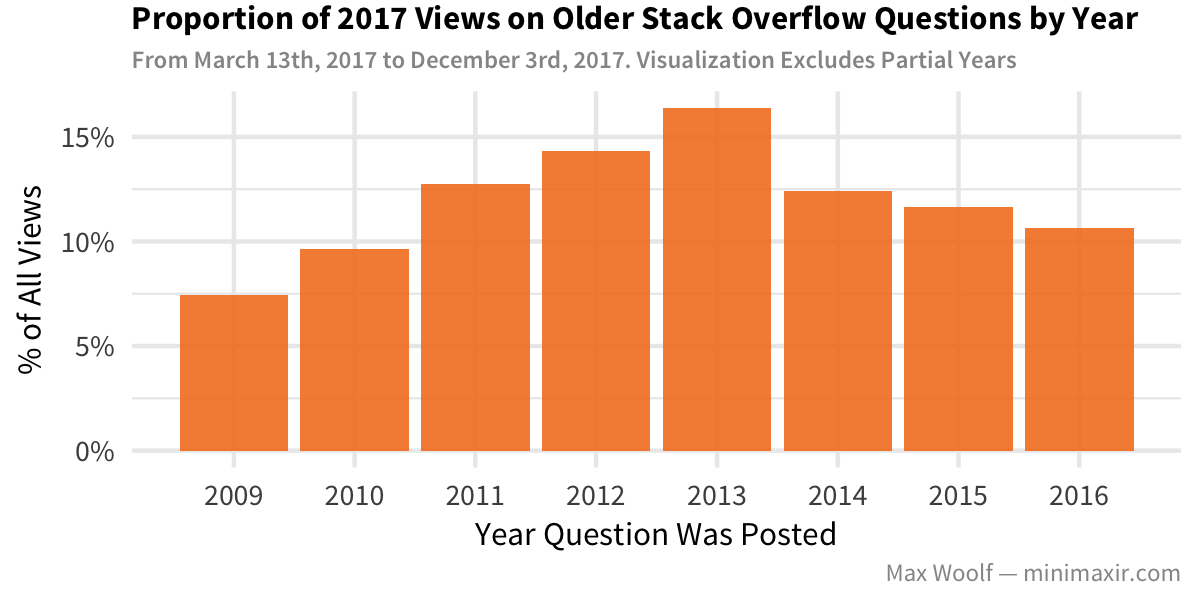
Unlike social media sites like Twitter and Reddit where the majority of traffic is driven within the first days after something is posted, posts on evergreen content sources like Stack Overflow are still relevant many years later. In fact, the traffic to Stack Overflow for most of 2017 (derived by finding the difference between question view counts from archive snapshots) is approximately uniform across question age, with a slight bias toward older content.
In 2017, Stack Overflow received about 40k-50k new questions each week, an impressive feat:
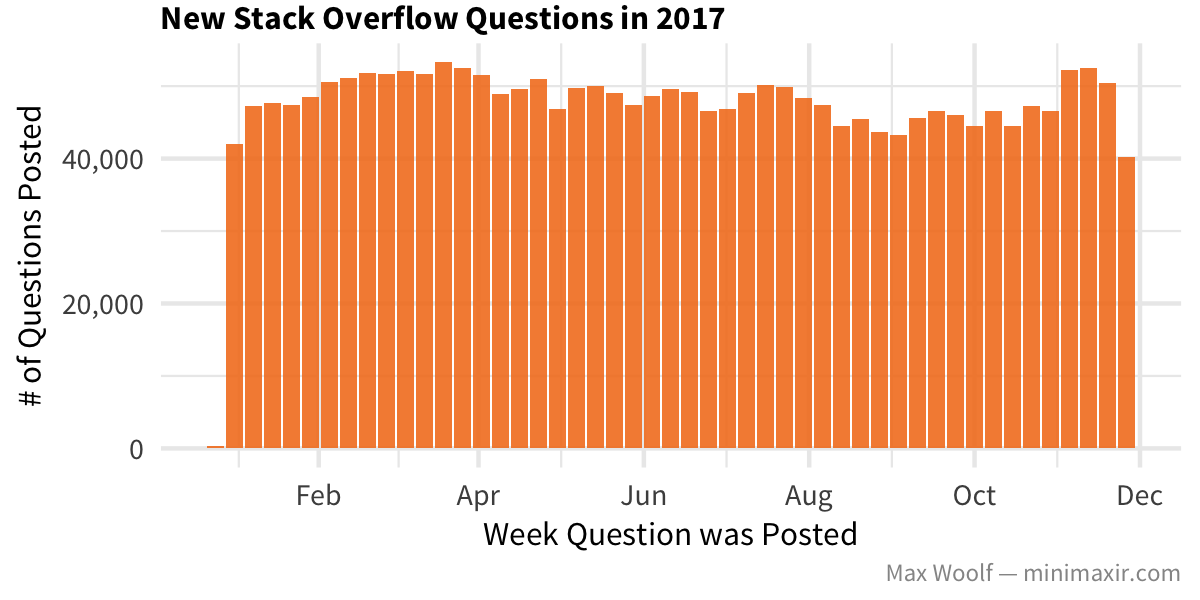
For the rest of this post, we’ll only look at questions made in 2017 (until December; about 2.3 million questions total) in order to get a sense of the current development landscape, and what’s to come in the future. But what types of questions are they?
Tag Breakdown
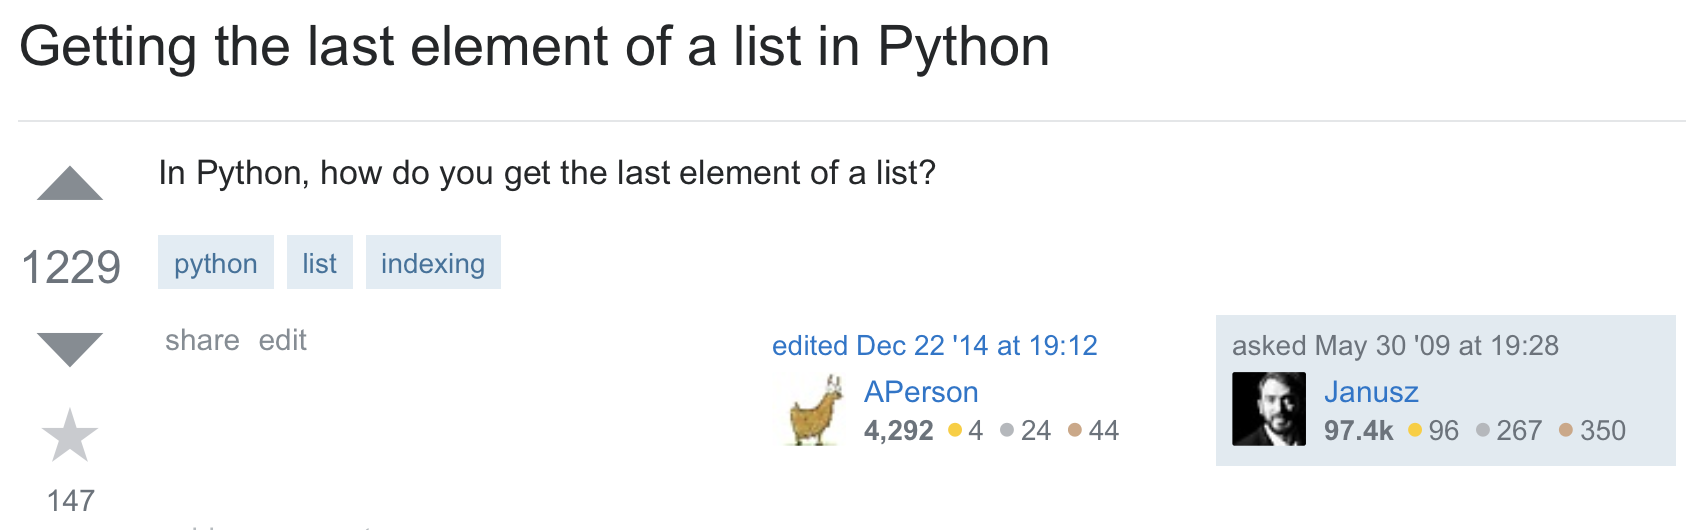
All questions on Stack Overflow are required to have atleast 1 tag indicating the programming language/technologies involved with the question, and can have up to 5 tags. In the example “how do you get the last element of a list in Python” question above, the tags are python, list, and indexing. In 2017, most of new questions had 2-3 tags. (i.e. people aren’t tag spamming like on Instagram for maximum exposure).
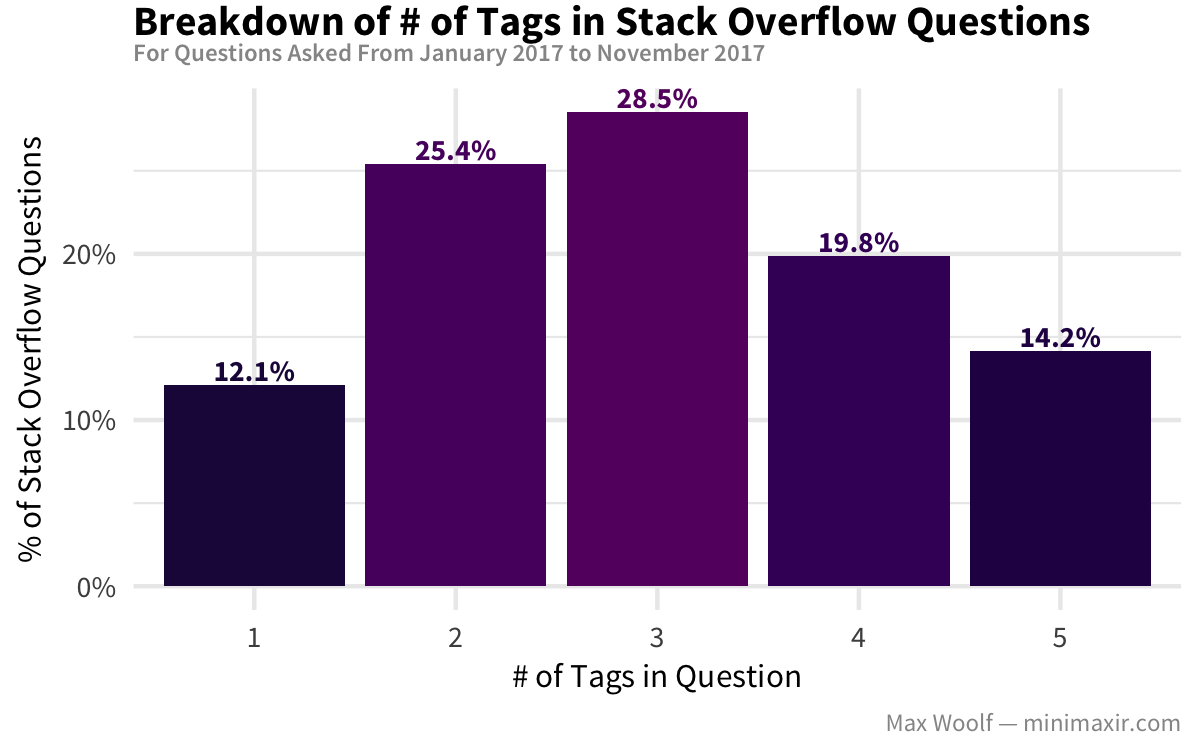
In theory, tag spamming might make a question more likely to be answered; however for all tag counts, the proportion of questions with accepted answer (the green checkmark) is 36-39%, so there’s not much practical benefit from minmaxing tag counts. Which types of tagged questions are most likely to be answered?
First, here’s the breakdown of the top 40 tags on Stack Overflow, by the number of new questions containing that tag for each month throughout 2017. This can give a sense of each technology’s growth/decline throughout the year.
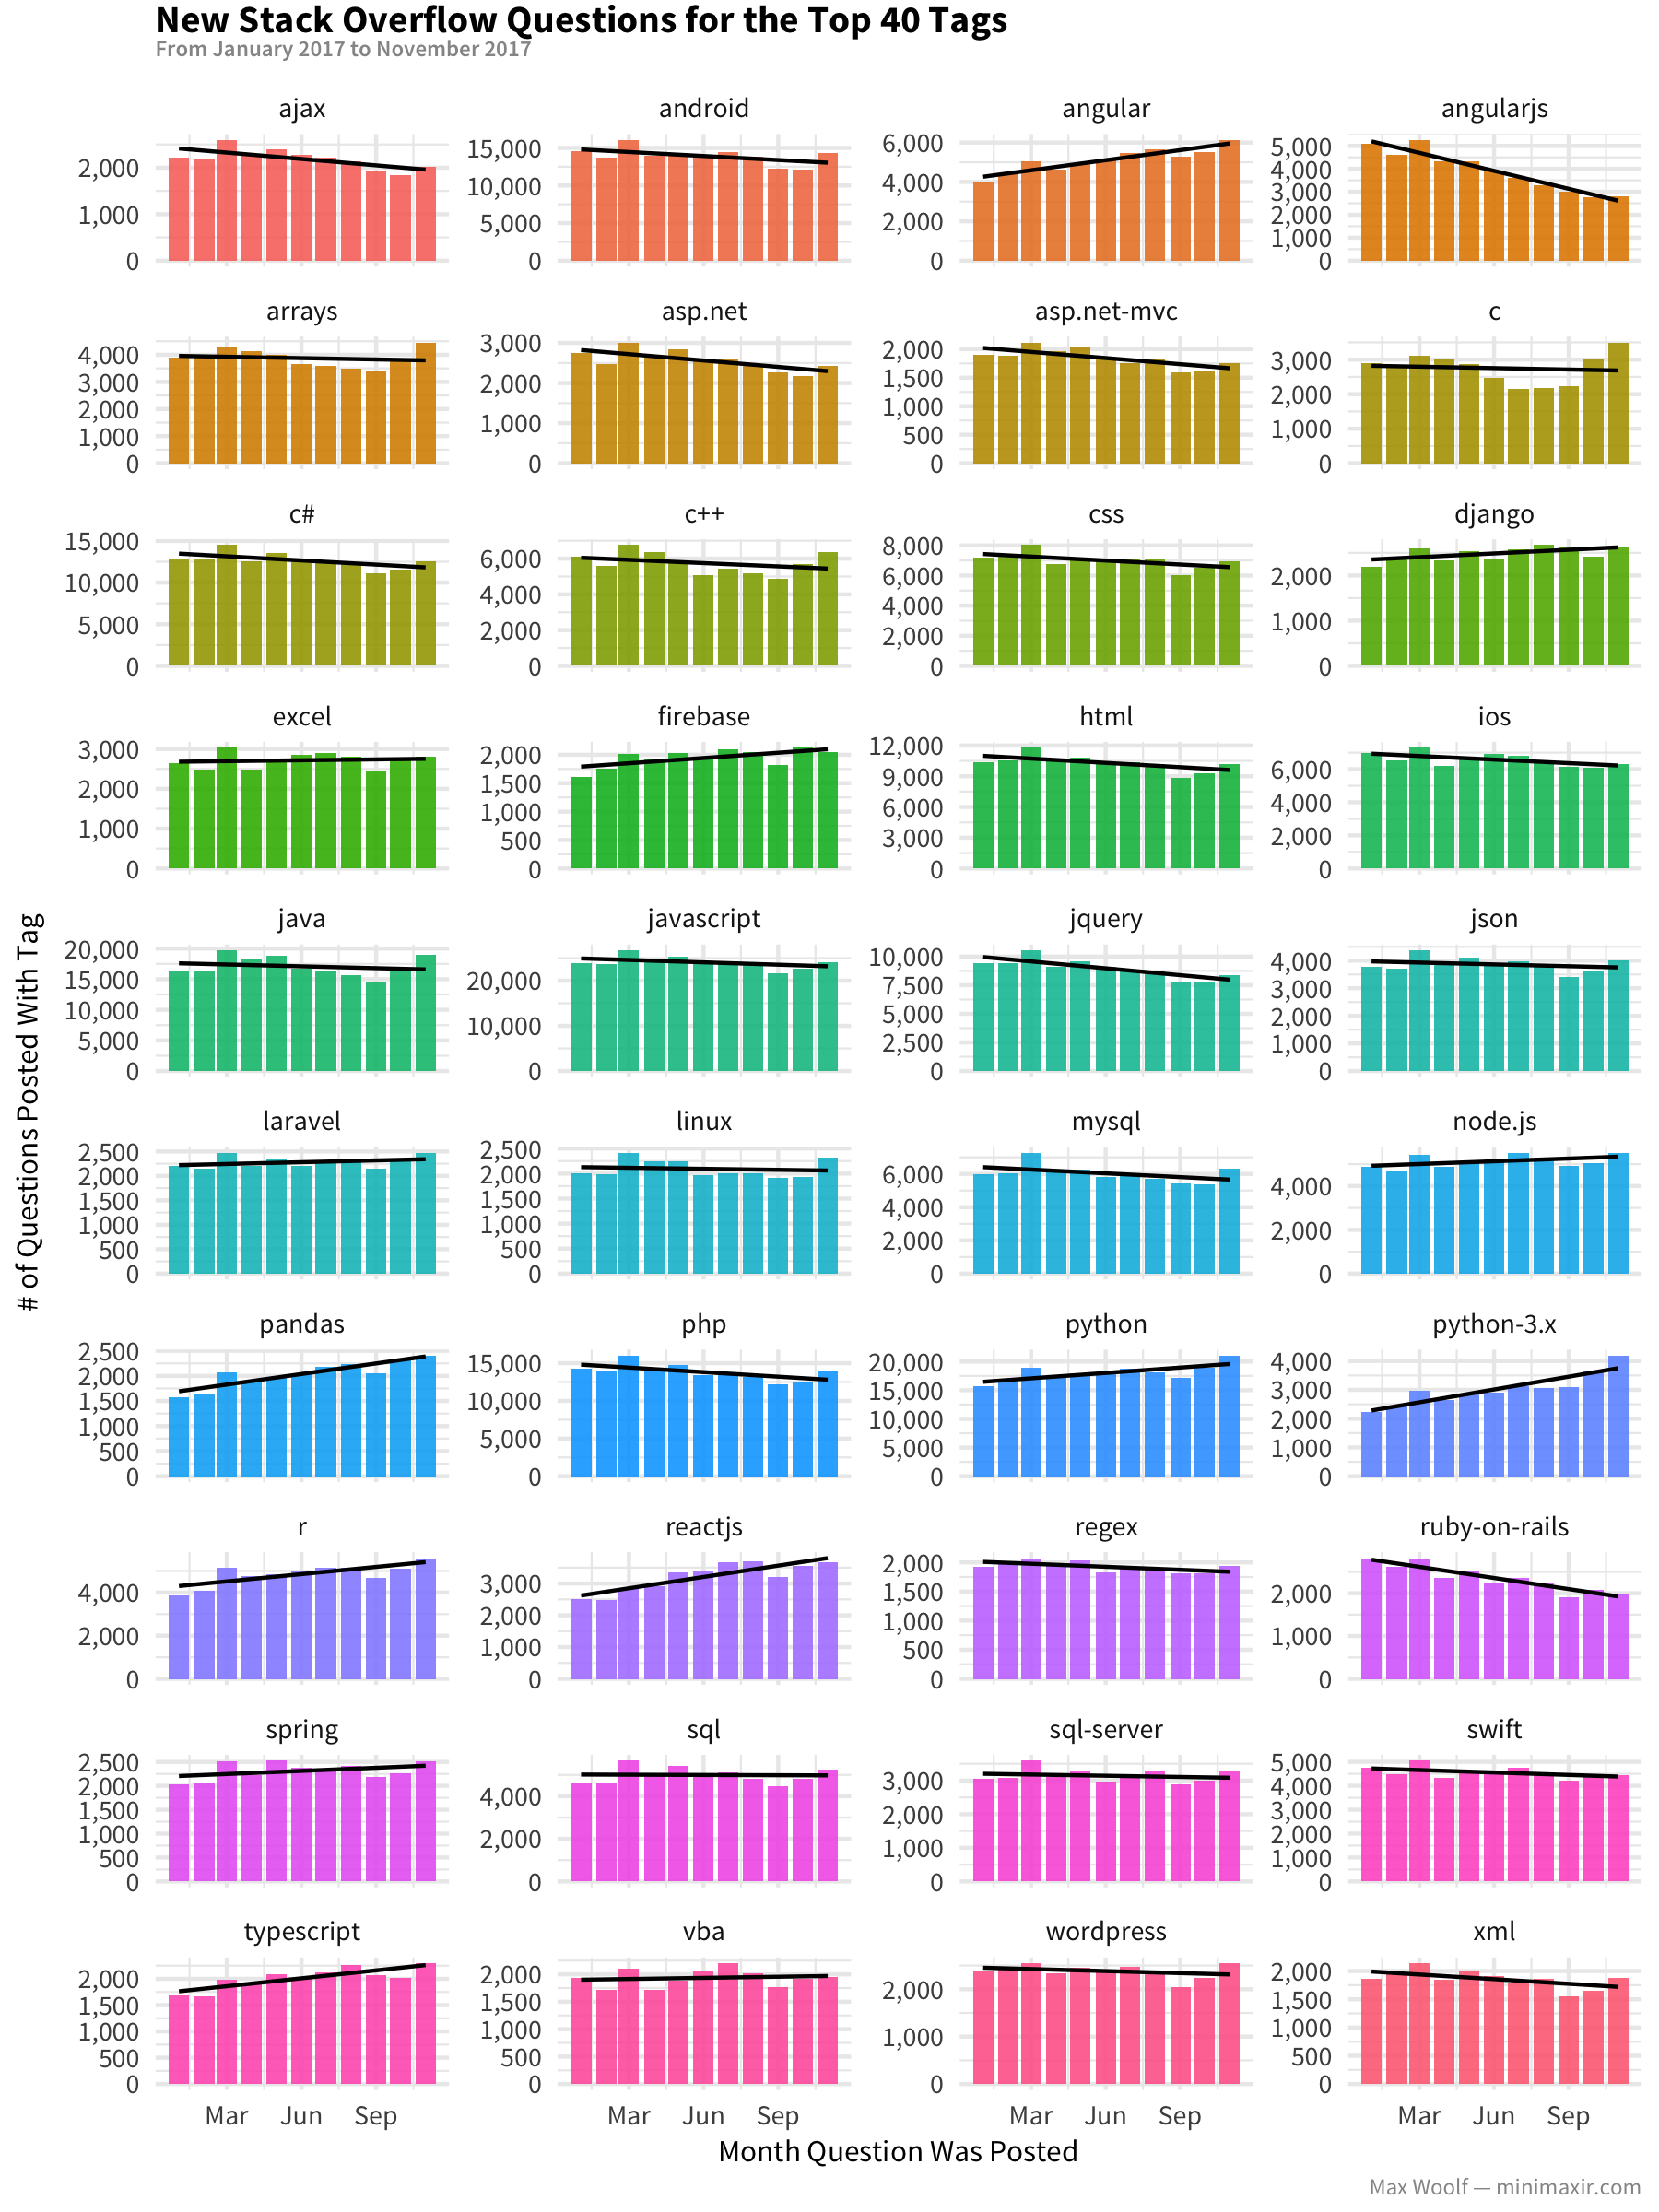
Both new web development technologies like reactjs and typescript and data science tools like pandas and r are trending upward.
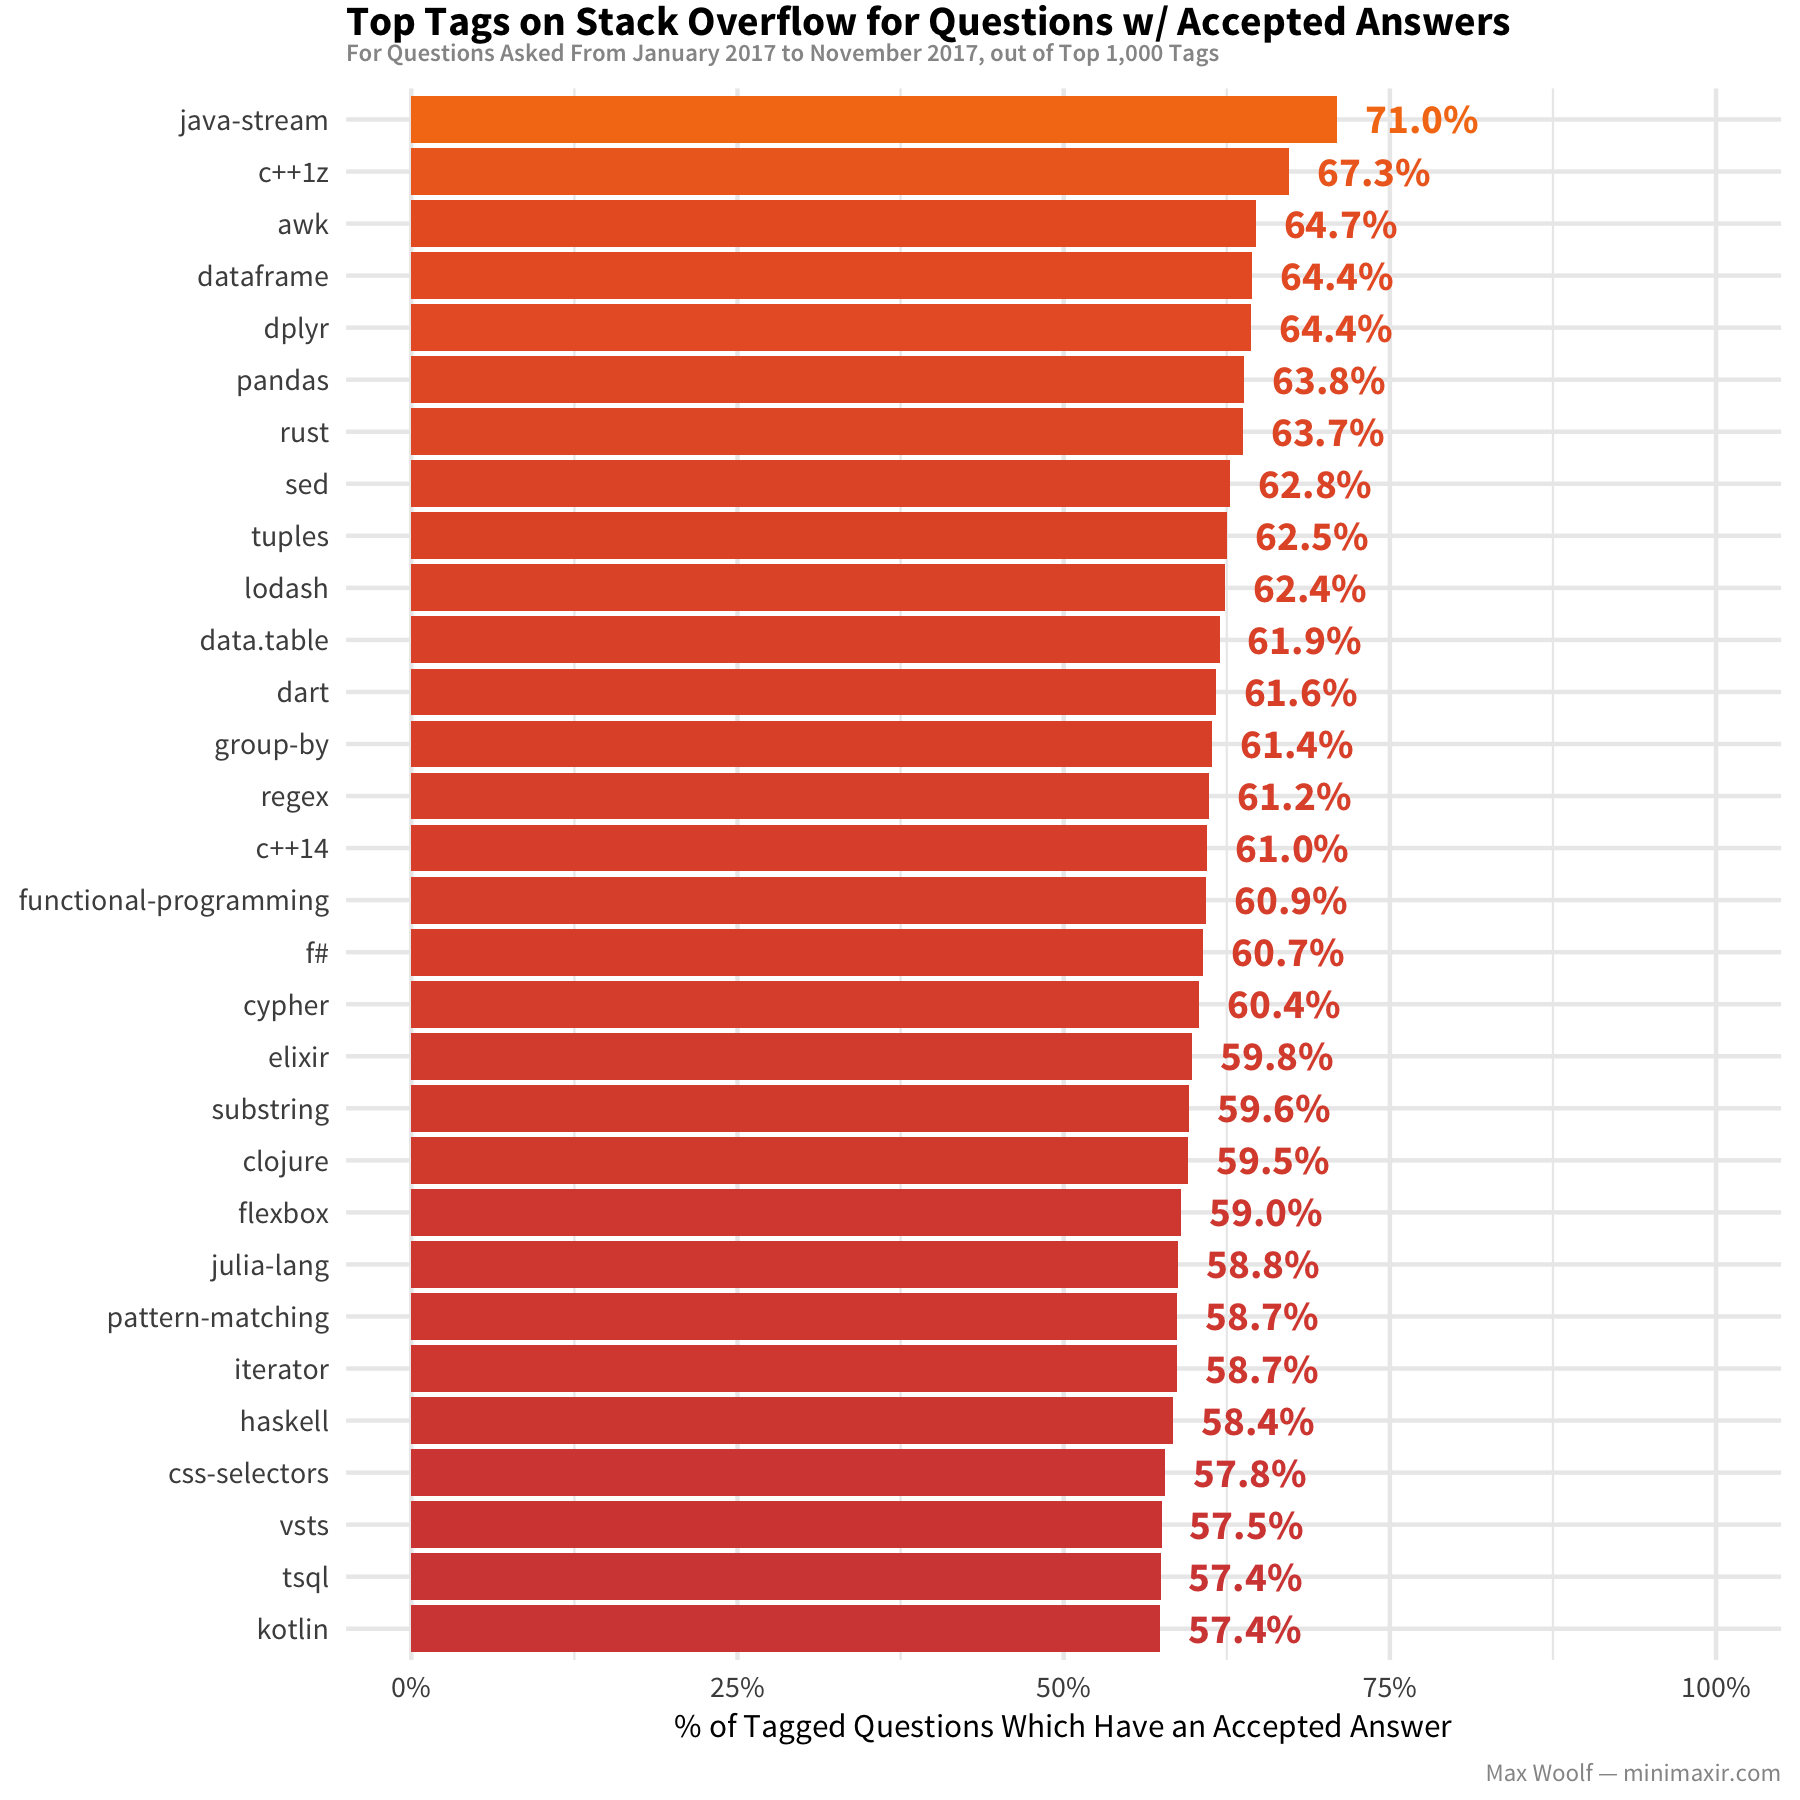
For the Top 1,000 tags, here are the top 30 tags by the proportion of questions which received an acceptable answer:
In contrast, here are the bottom 30 out of the Top 1,000:
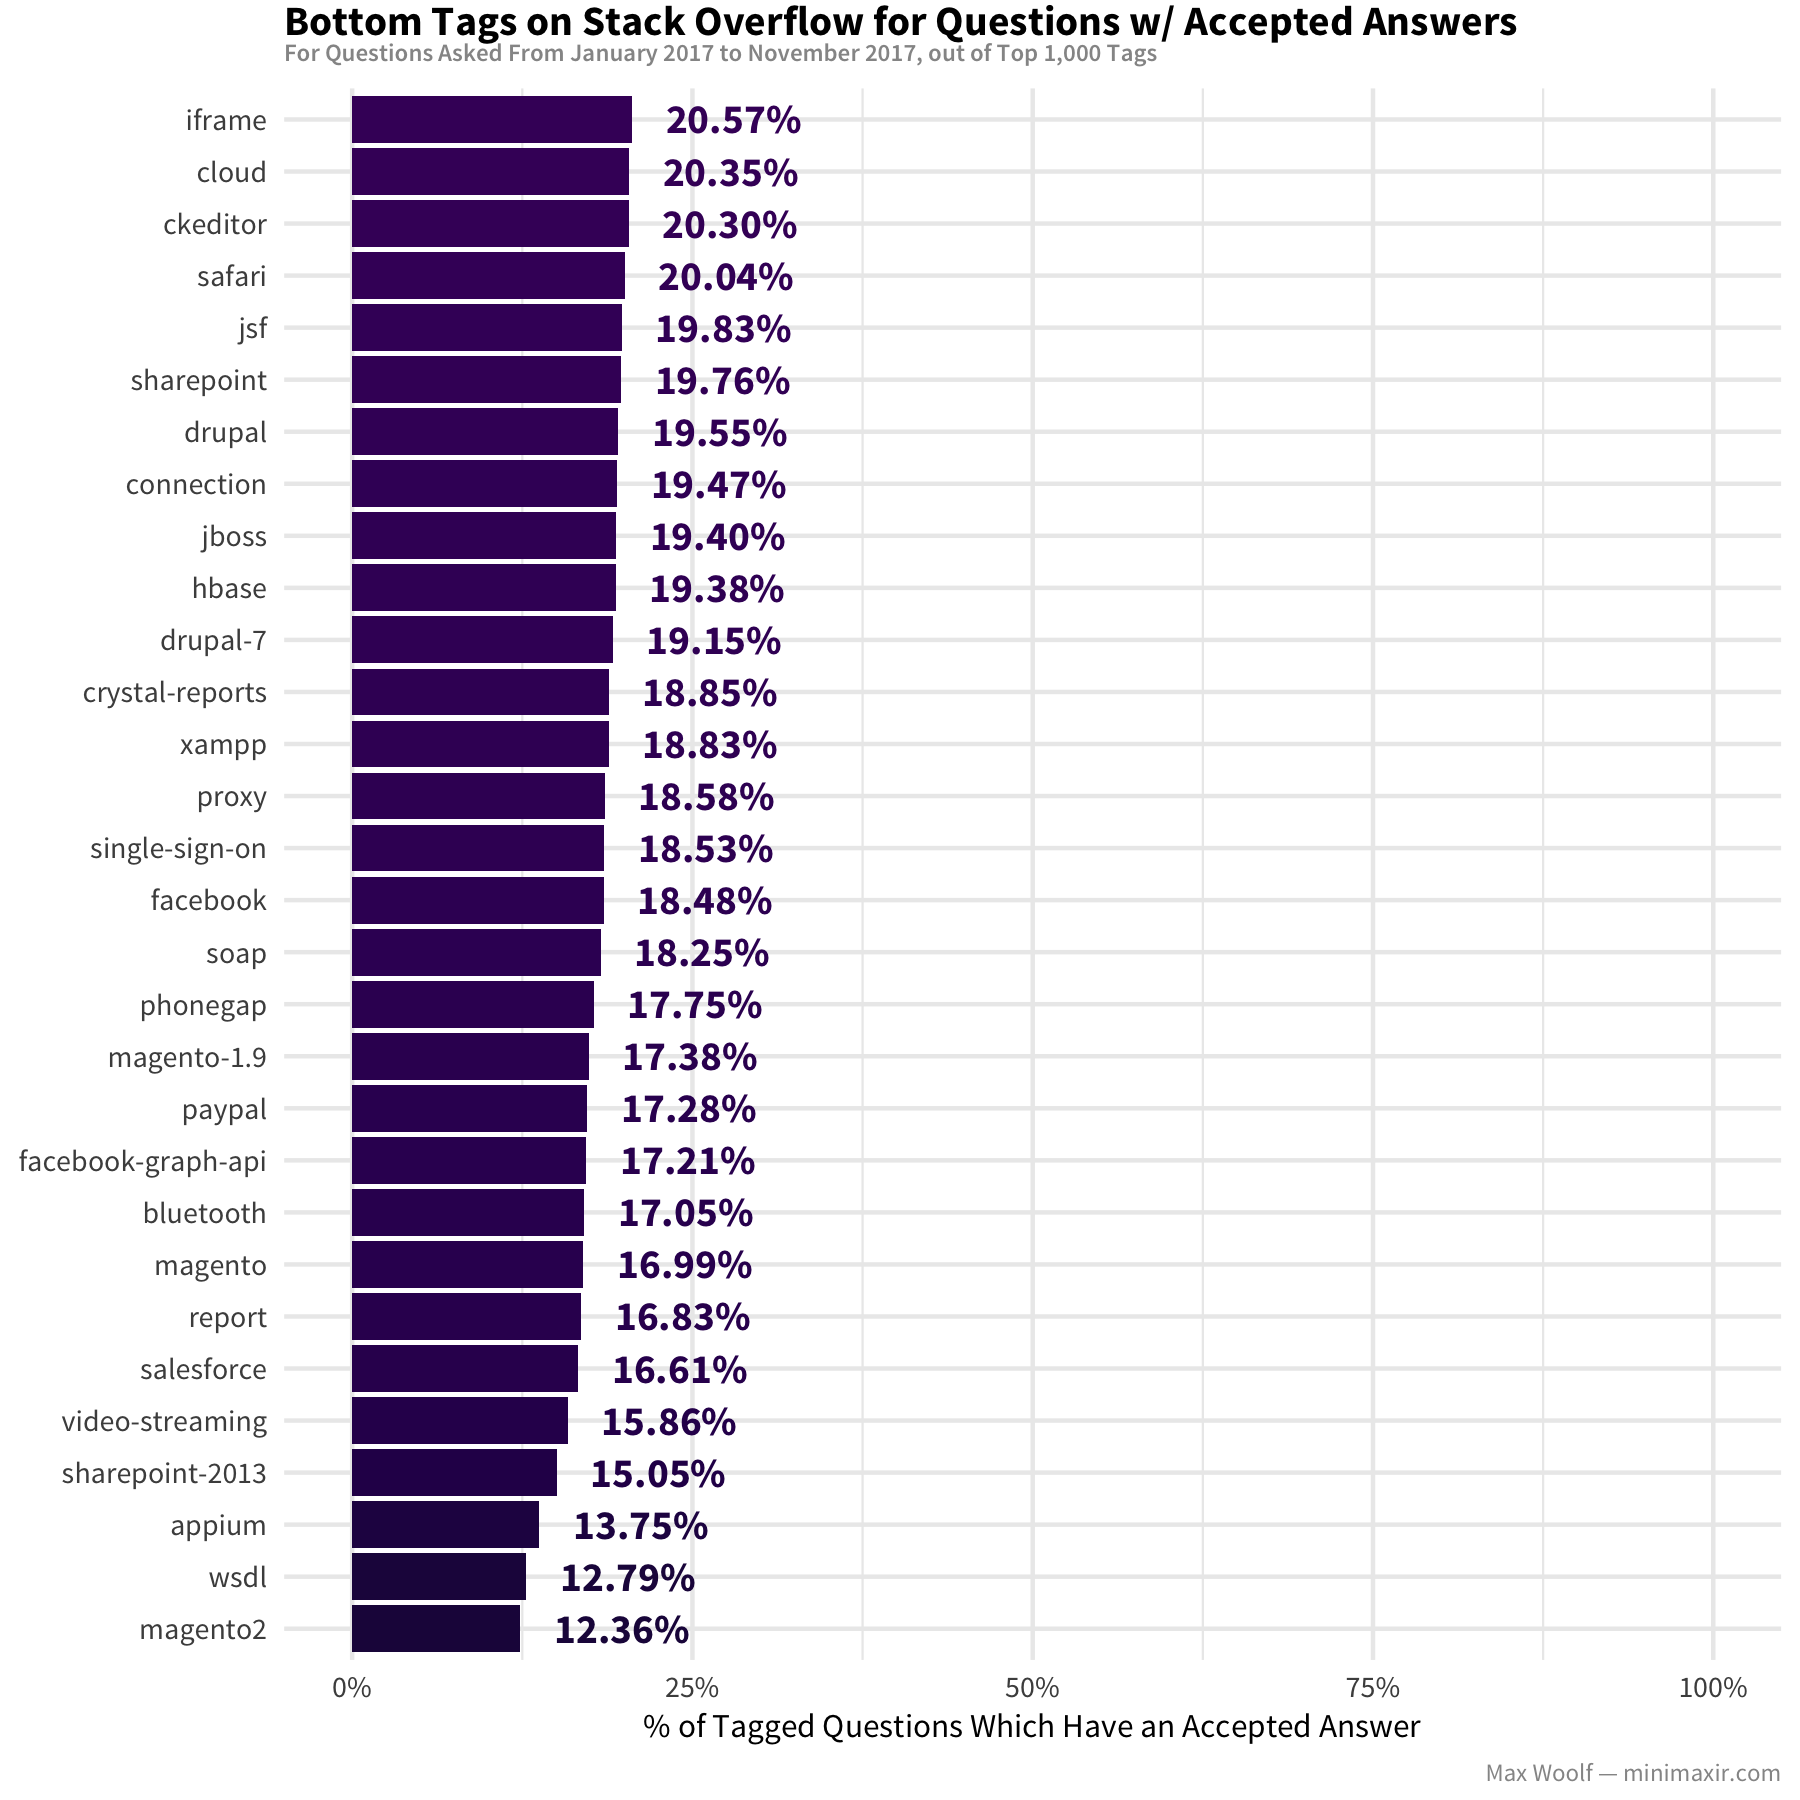
The top tags are newer, sexier technologies like rust and dart, with another strong hint of data science tooling with dplyr (which I used to aggregate the data for this post!) and data.table. In contrast, the bottom tags are less sexy and more corporate like salesforce, drupal, and sharepoint-2013 (that’s why consultants who specialize in these technologies can get paid very well!).
It should be noted these two charts do not necessarily imply that one technology is “better” than another, and the difference in answer rates may be due to question difficulty and the number of people skilled in the tech available that can answer it effectively.
The timing when questions are asked might vary by tag. Per a Stack Overflow analysis, people typically ask questions during the 9 AM - 5 PM work hours (although in my case, I cannot easily adjust for the time zone of the asker). How does this data fare?
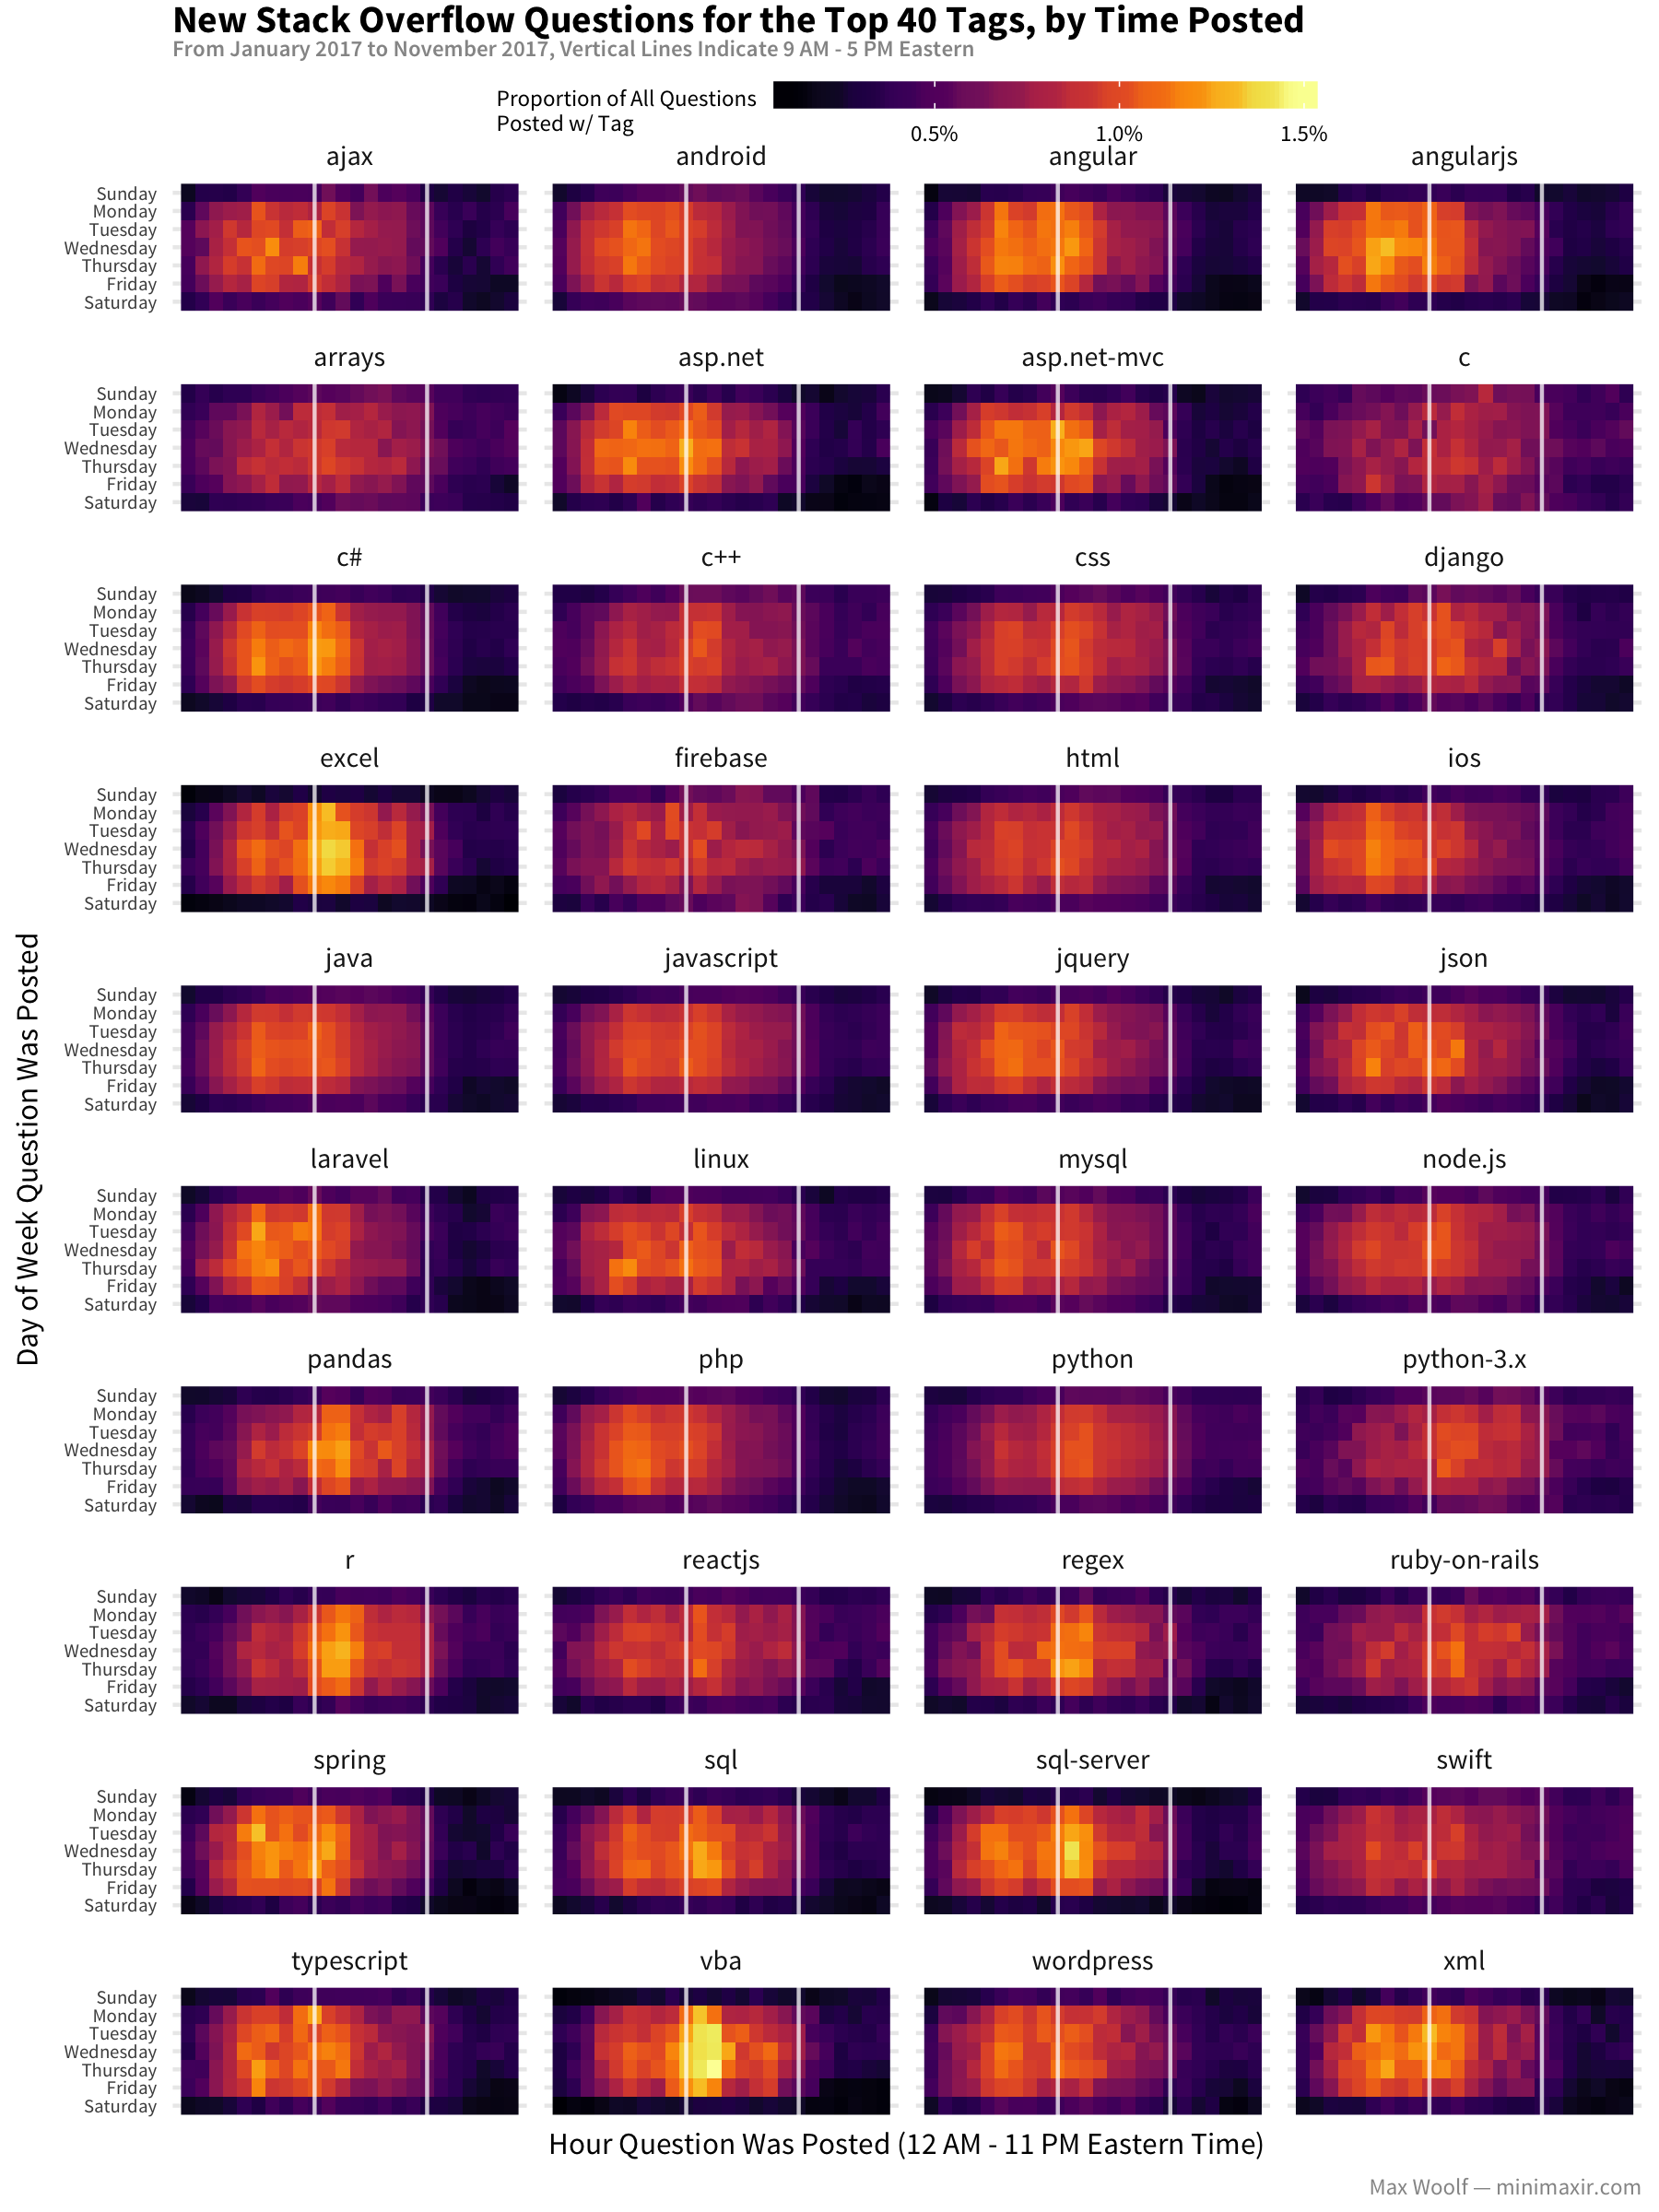
This visualization is a bit weird. I adjusted the times to the Eastern time since internet activity for U.S.-based websites tends to revolve around that time zone. But for most technologies, the peak question-asking times are well before 9 AM to 5 PM: do those technologies correspond more to greater use in Europe and Asia? (In contrast, data-oriented technologies like r, pandas and excel do peak during the 9-5 block).
How easy is it to get an answer by tag?
Stack Overflow caters the homepage toward the logged-in user’s recommended tags. Therefore, it’s not a surprise that the distribution of view counts on 2017 questions for each tag are very similar, although there is a slight edge toward the new “hip” technologies like typescript, spring, and swift.
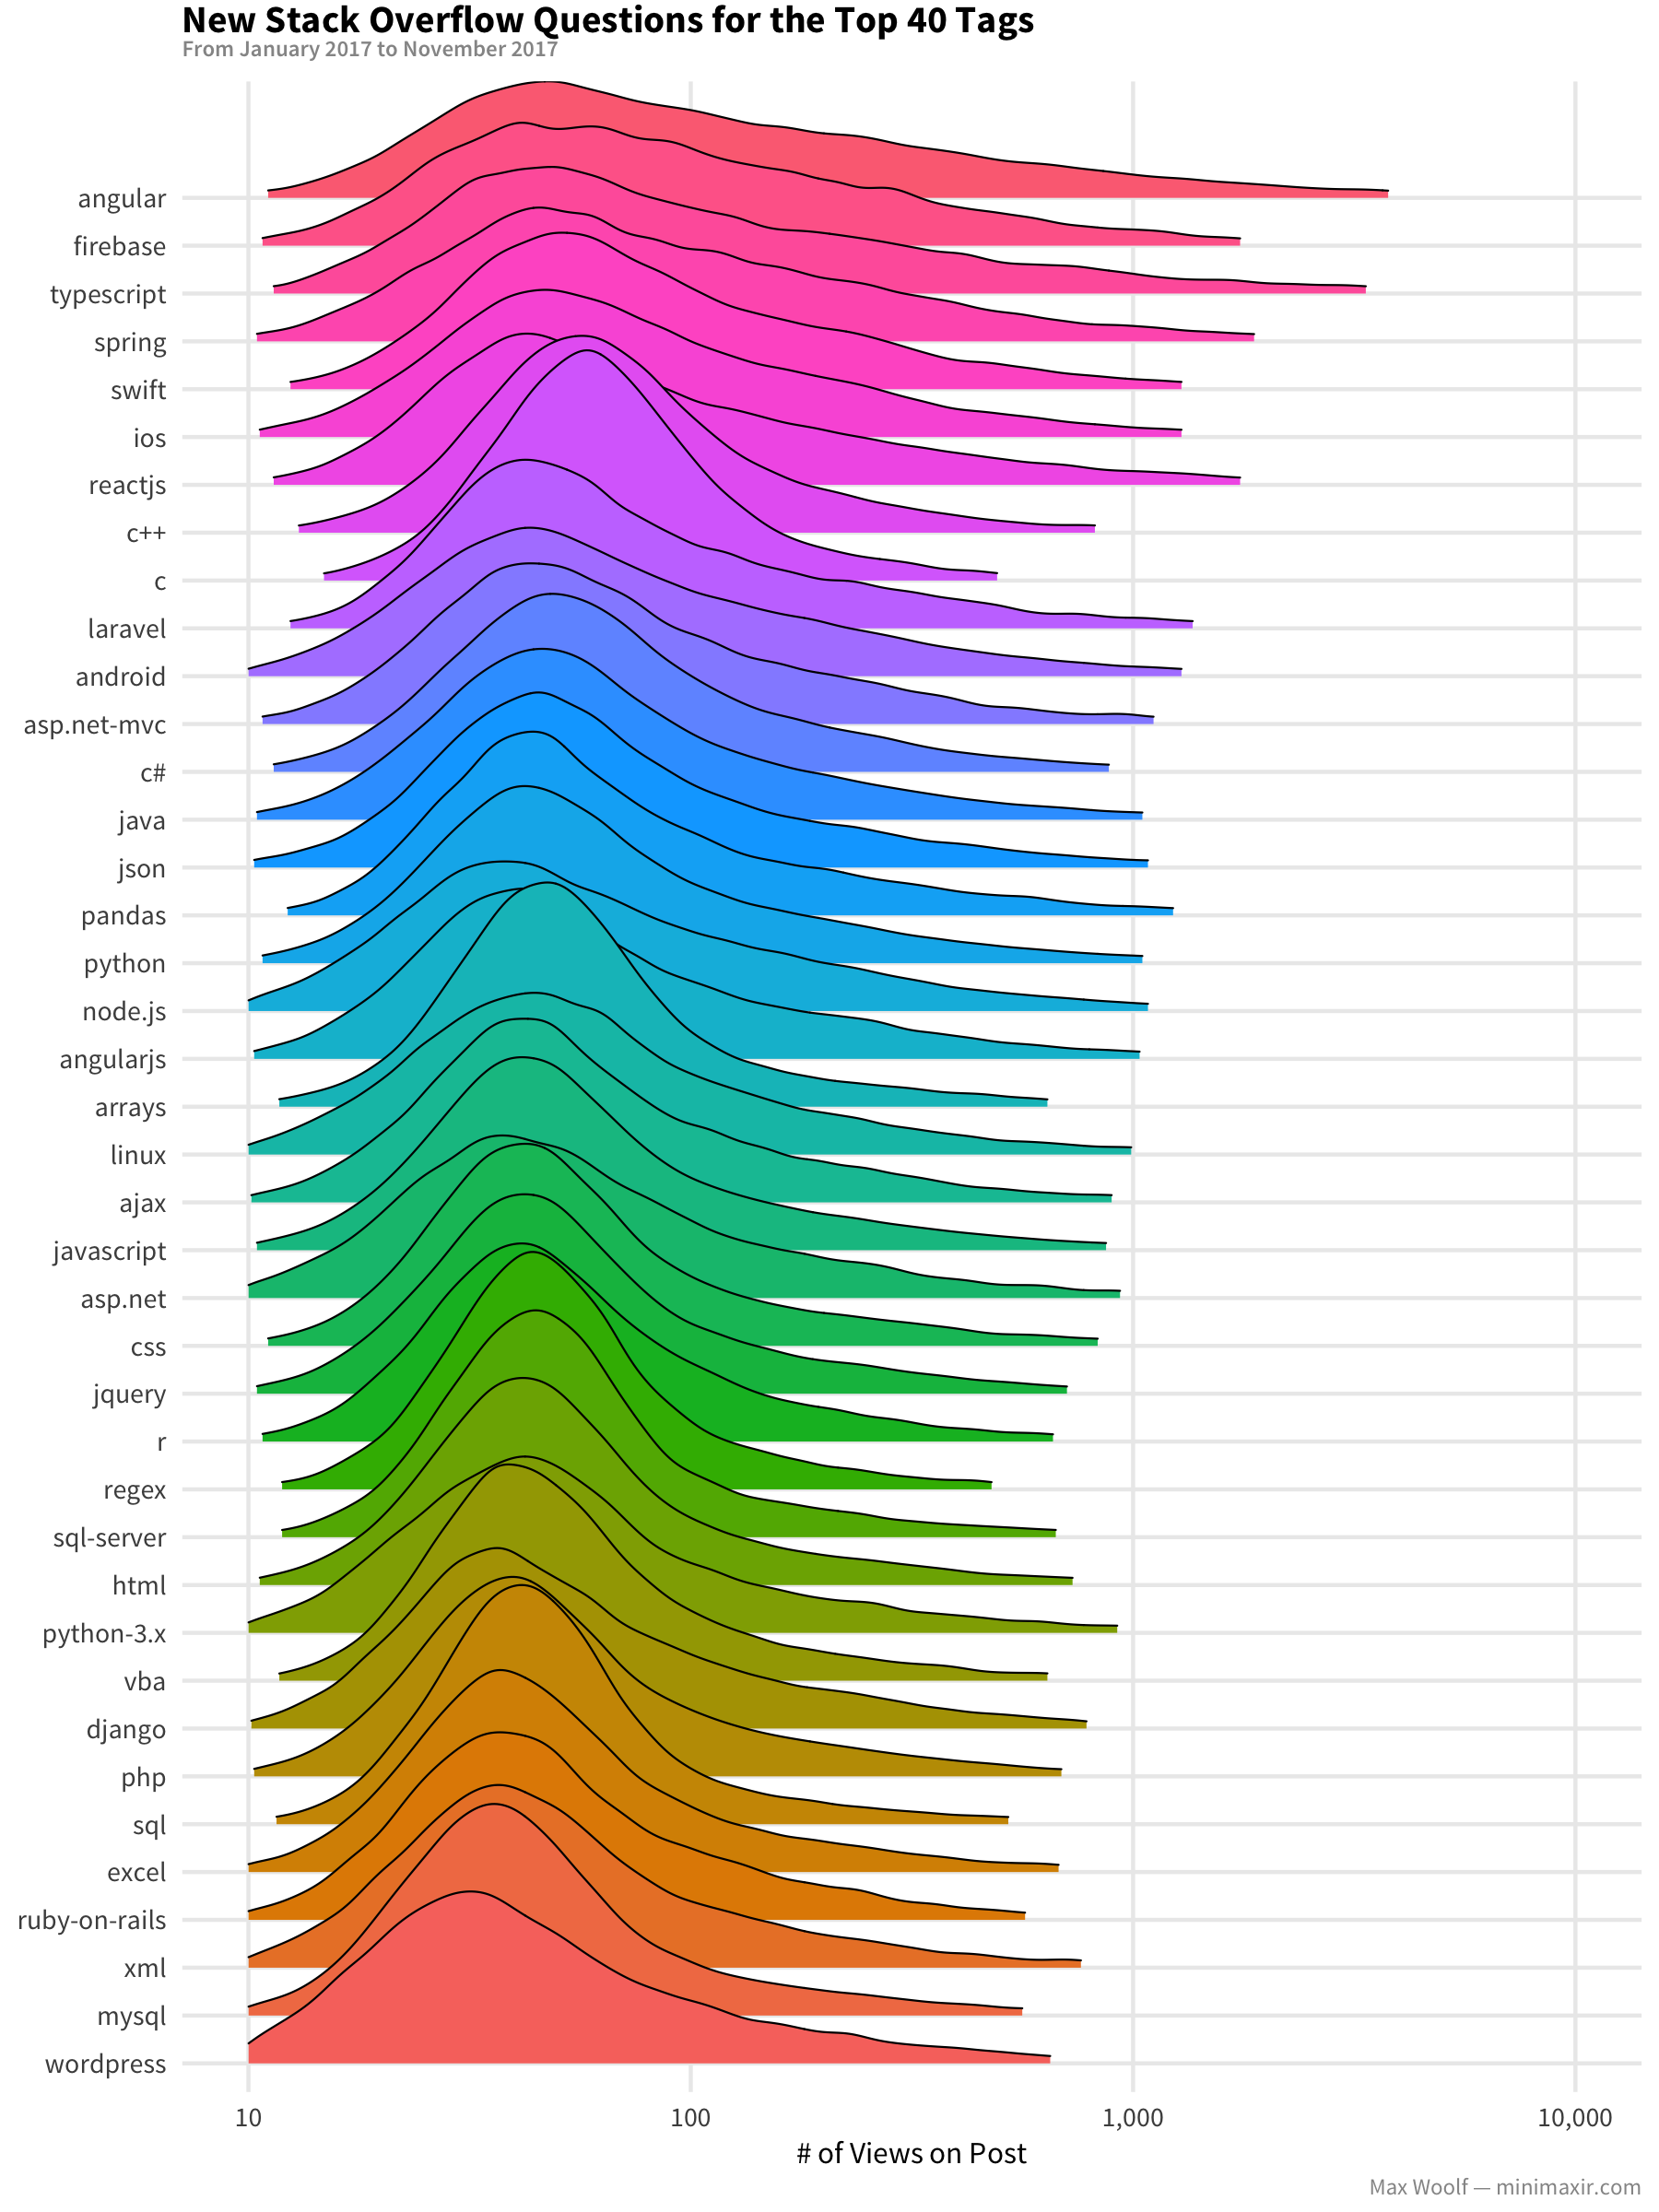
At the least, the distribution ensures that atleast 10 people see your question for these popular topics, which is nifty when you consider posts on Twitter and Reddit can die without any visibility at all. But will they provide an acceptable answer?
The time it takes to get an acceptable answer also varies significantly by tag:
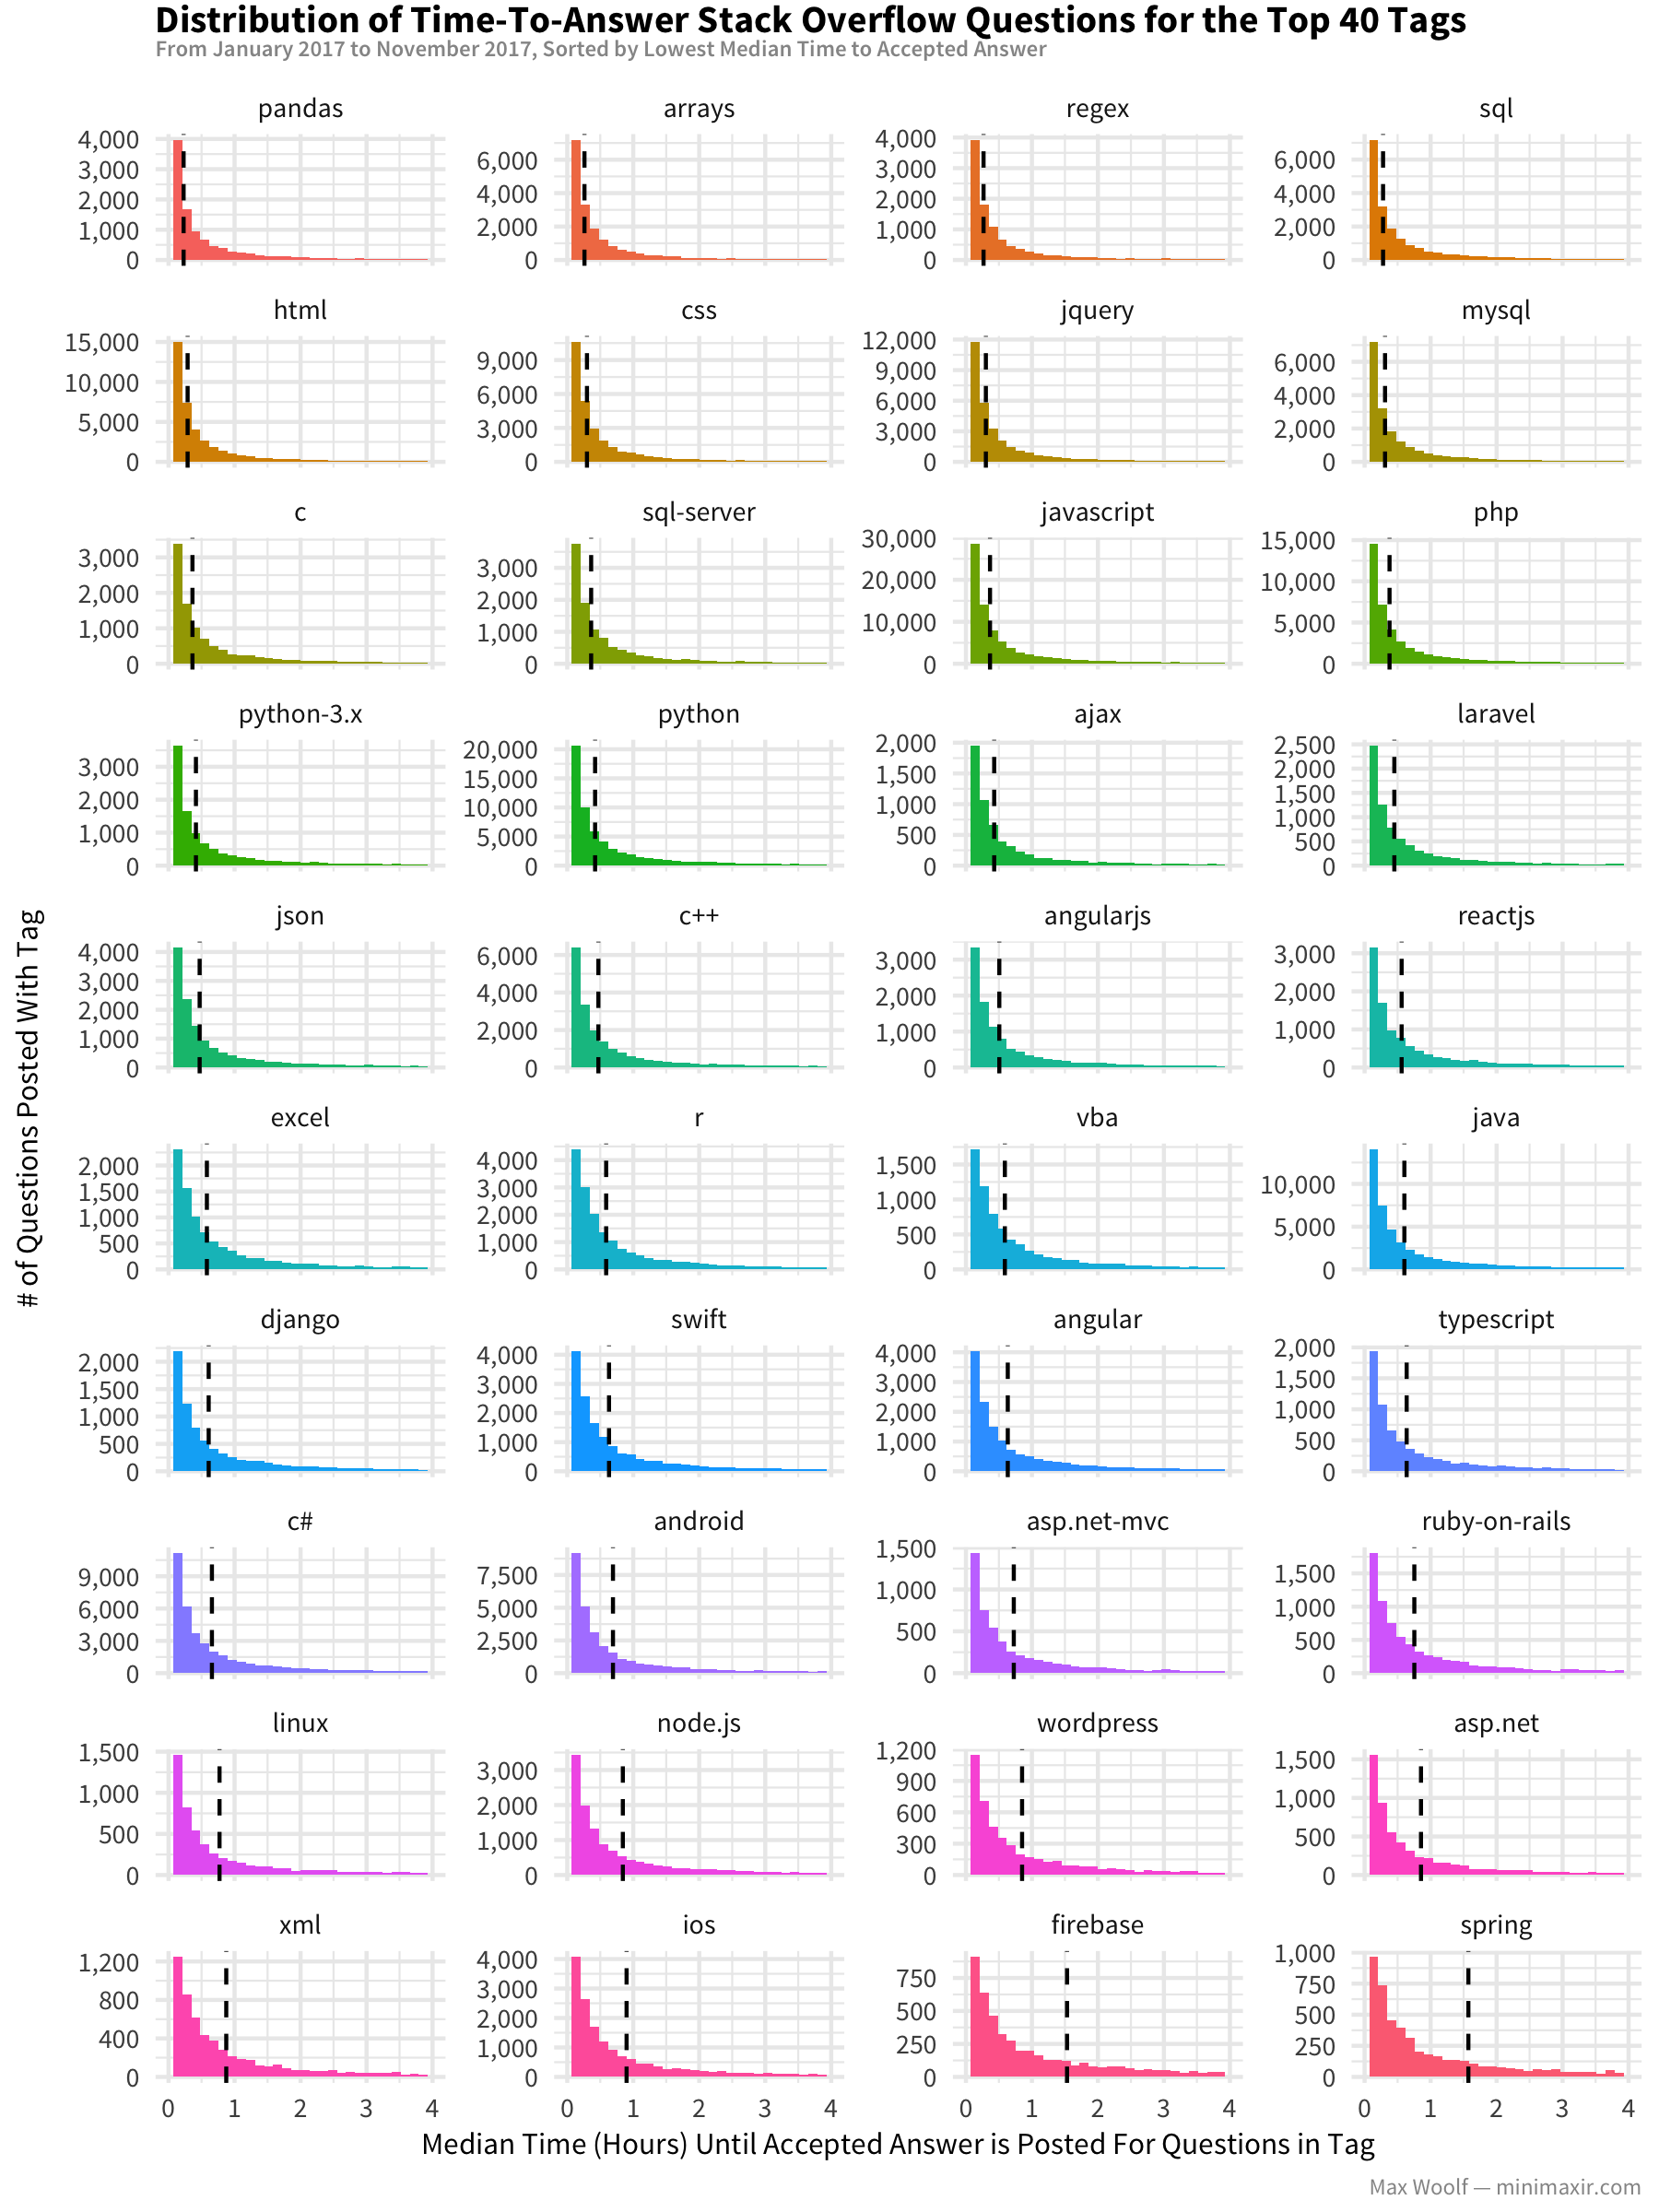
A median time of 15 minutes for tags like pandas and arrays is pretty impressive! And even in the worst case scenario for these popular tags, the median is only a couple hours, much lower than I thought it would be.
The Relationship Between Tags
As one would expect, the types of questions asked for each tag are much different. Here’s a wordcloud for each of the tags, quantifying the words most frequently used in the questions on those tags:

Notably, each word cloud is significantly different from reach other, even when technologies are related (also surprisingly true in the case of angular and angularjs!).
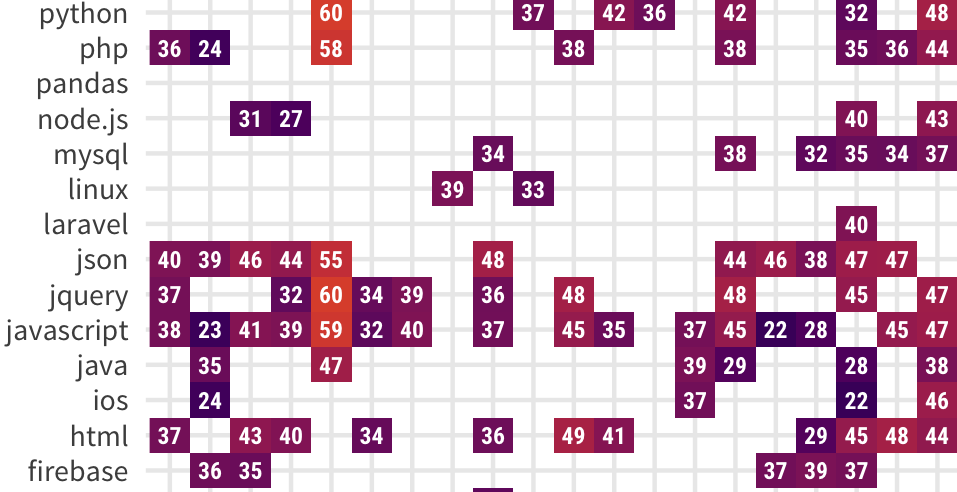
How are the tags related anyways? We can calculate an adjacency matrix of the tag pairs in the questions to see which tags are related:
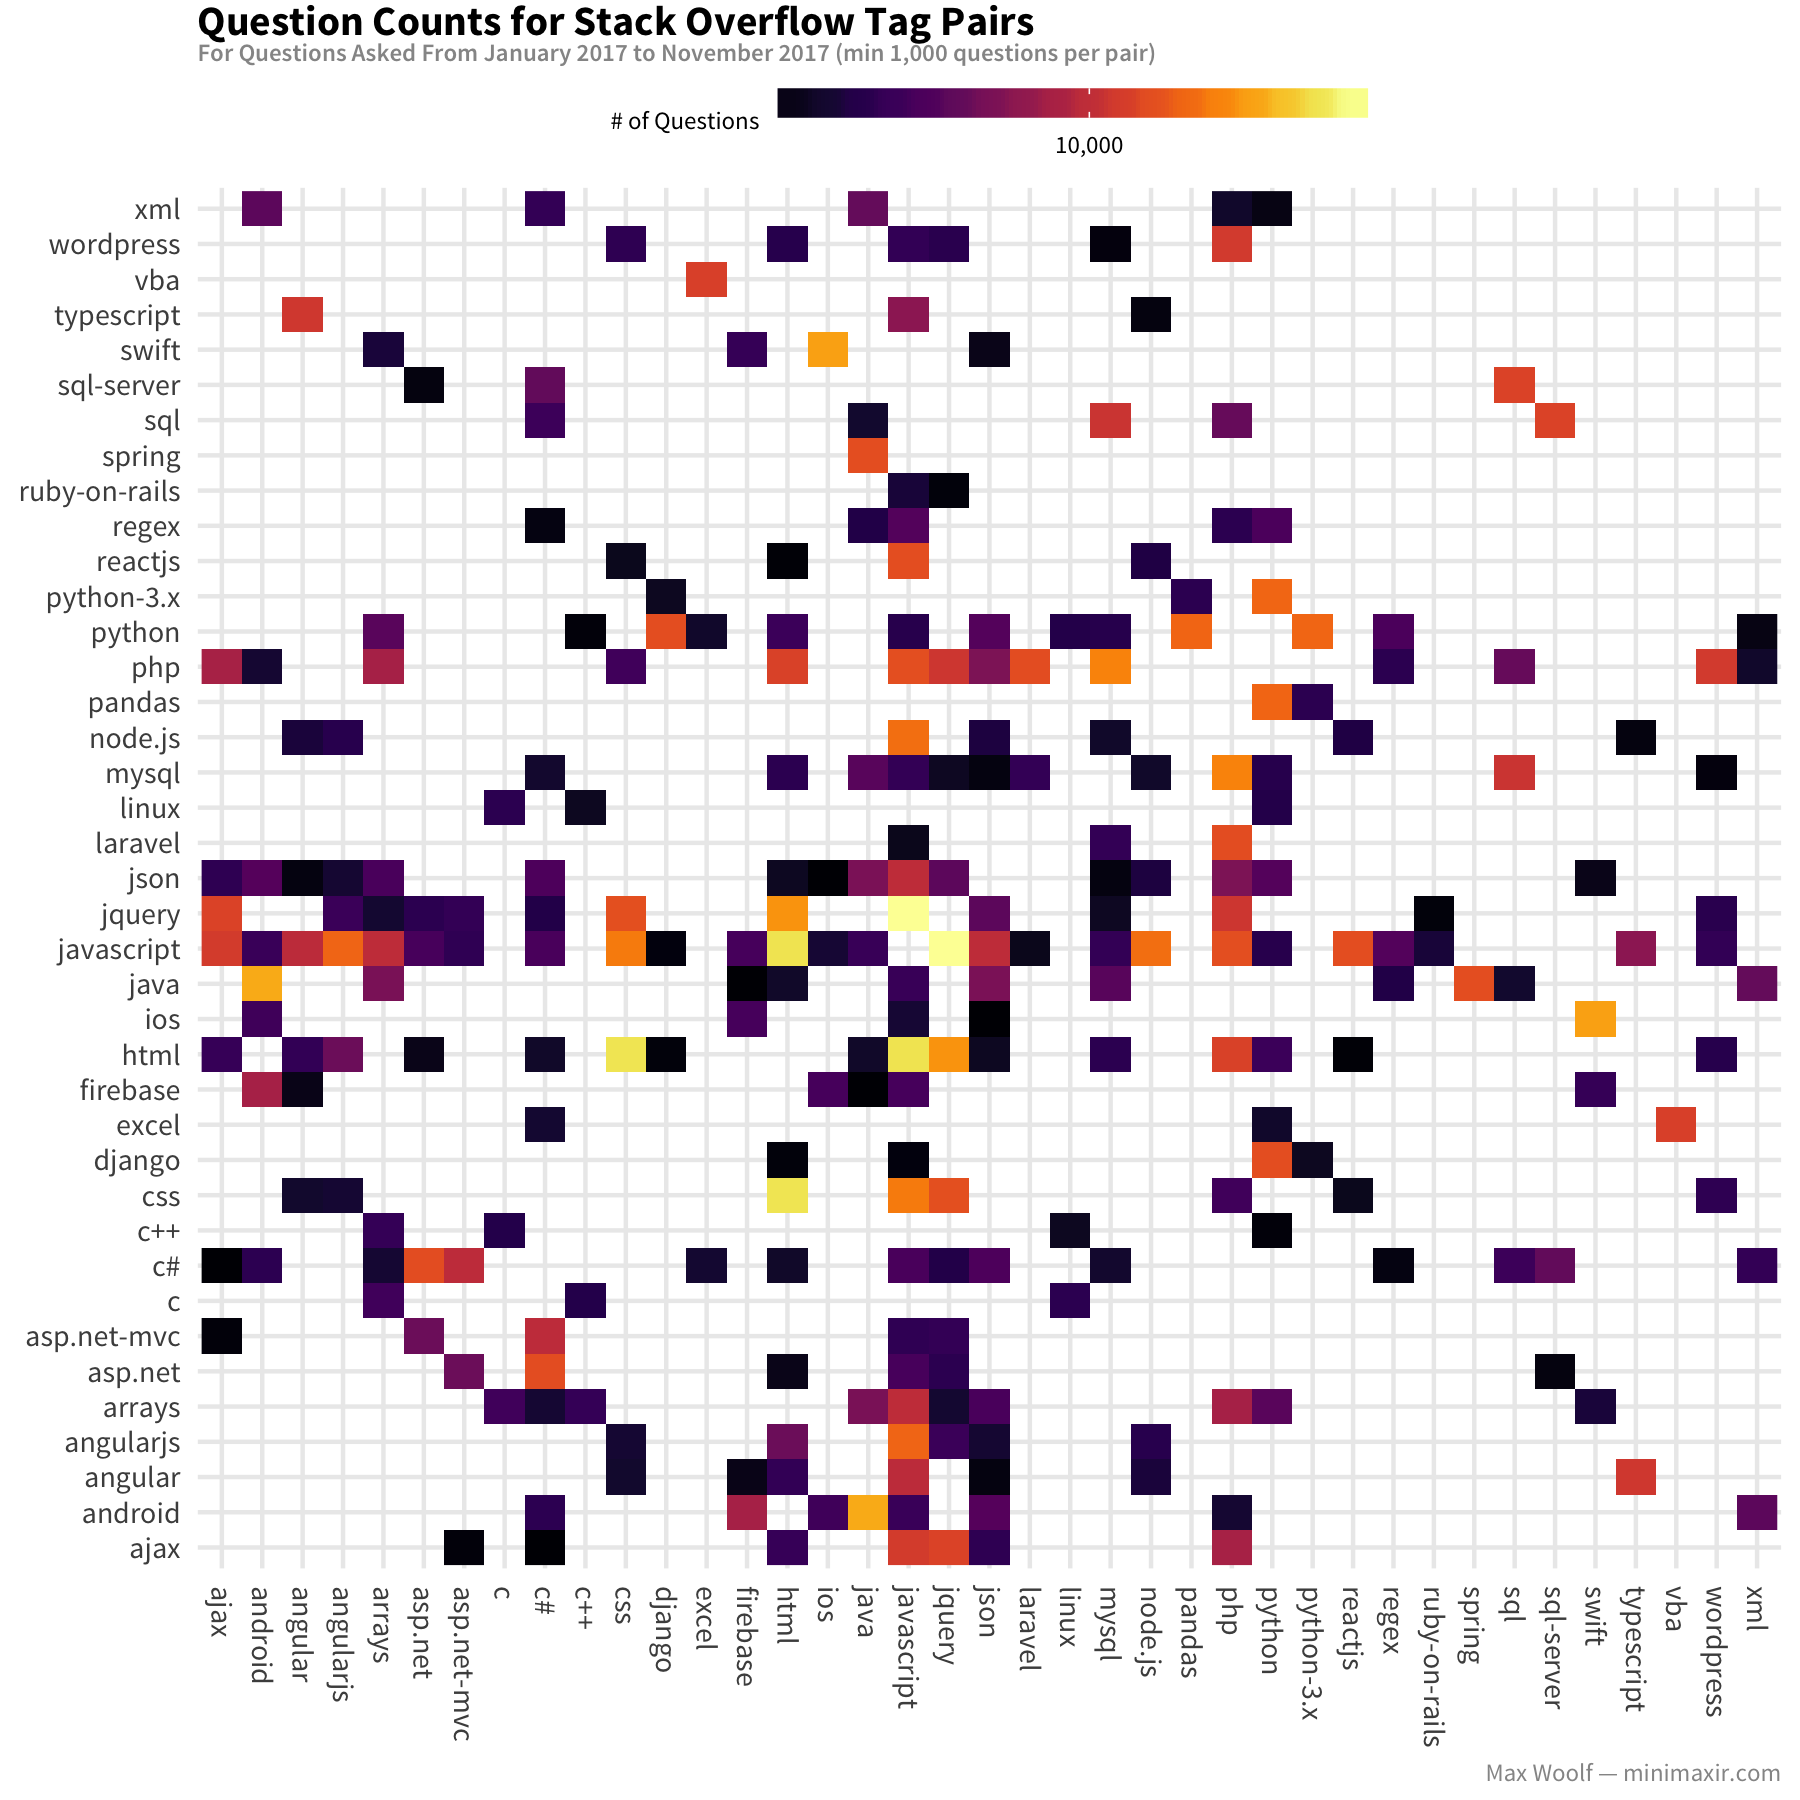
Looking down a given row/column, you can see which technologies have a lot of questions in common with another (for example, javascript and json are frequently asked in conjunction with other tags).
Going back earlier to talking about tag abuse, do the presence of certain pairs of tags lead to notably different answer rates?
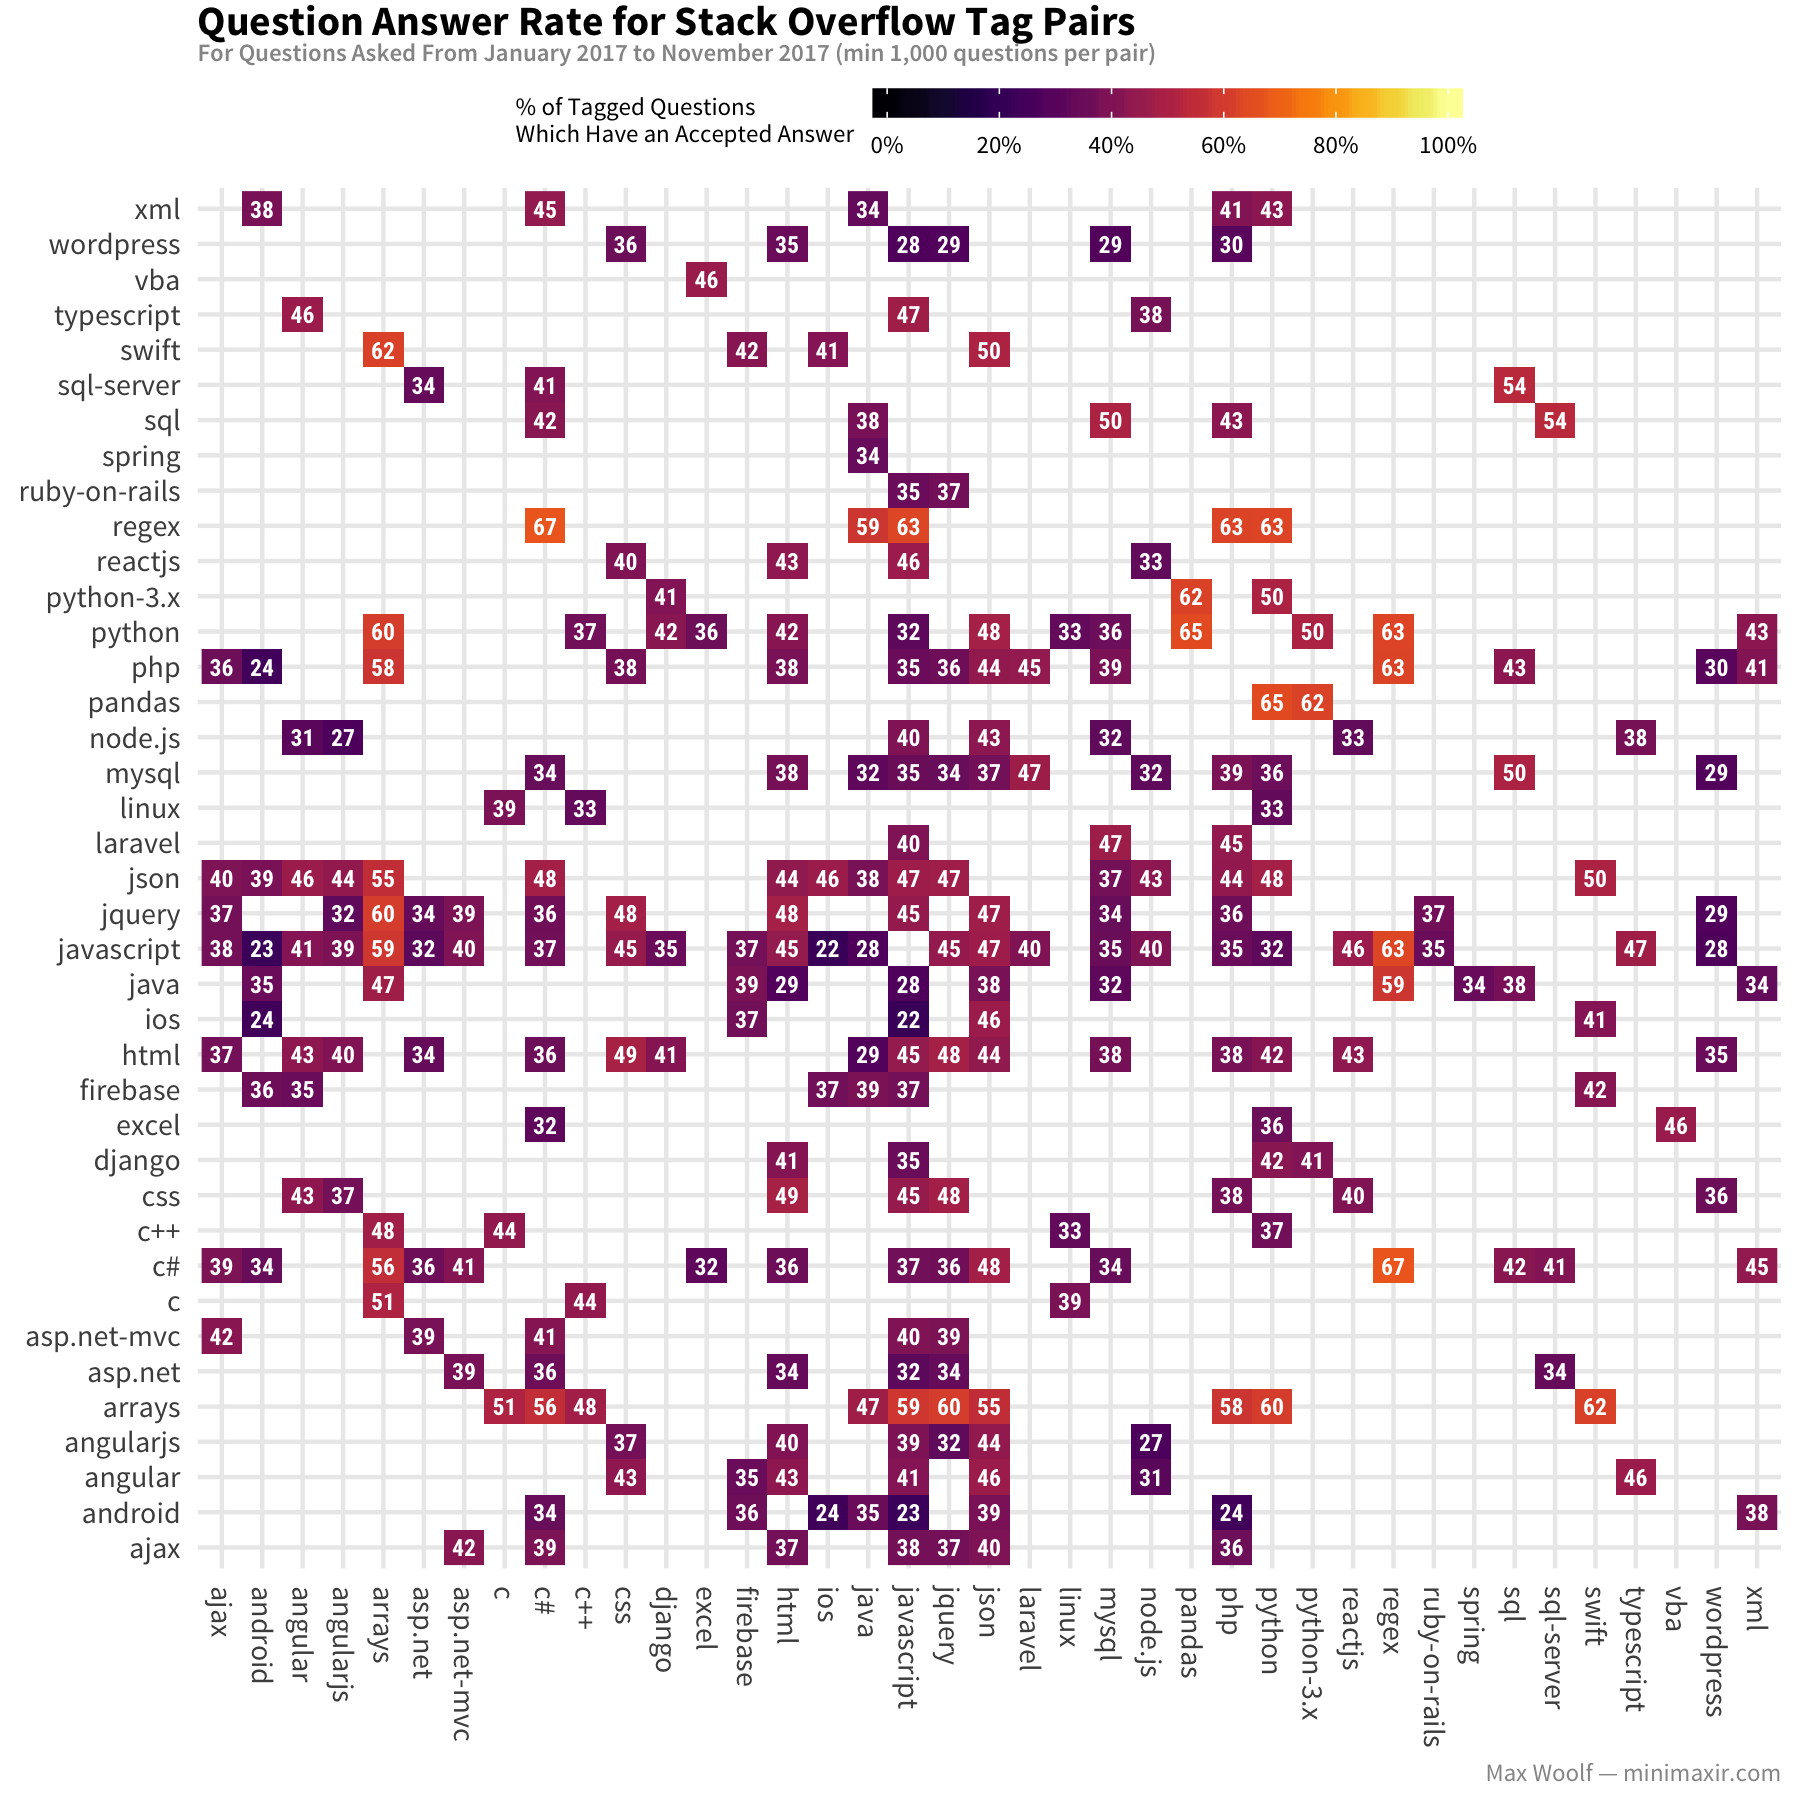
Tag pairs which don’t make much sense (e.g. ios+android, ios+javascript, android+php) tend to have very low answer rates (20%-30%). But tags with already high answer rates like regex don’t get much higher or much lower at a given pair.
Conclusion
There’s a lot more than can be done looking at question tags on Stack Overflow. I was surprised to see that all types of programming languages have quick answer times and a high probability of receiving an acceptable answer! I’ll definitely keep an eye on the SO archives as they are released, and I’m excited to see how trends change in the future.
You can view the R and ggplot2 code used to create the data visualizations in this R Notebook. You can also view the images/data used for this post in this GitHub repository.
You are free to use the data visualizations from this article however you wish, but it would be greatly appreciated if proper attribution is given to this article and/or myself!
