Rotten Tomatoes has become synonymous with movie quality in recent years. The Rotten Tomatoes Tomatometer aggregates all reviews written by movie critics for a given movie on the internet, determines whether each reviewer rates the movie as “Fresh” or “Rotten” and calculates an average. If the proportion of Fresh reviews for a given movie is greater than or equal to 60%, the movie itself is considered “Fresh” and receives a special icon.
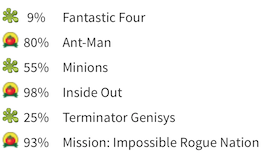
Top Movies like Christopher Nolan’s The Dark Knight received a 94% Rotten Tomatoes rating, and generated $533.3 million in domestic box office revenue. But other movies, like Michael Bay’s Transformers: Revenge of the Fallen, received a 19% Tomatometer rating, but still generated $402.1 million in domestic box office revenue.
How strong is the relationship between Tomatometer scores and box office success, anyways? Or are other, better metrics? Time to make some pretty charts.
I obtained a large amount of movie data from the OMDb API, which provides easy access to movie metadata from IMDb and Rotten Tomatoes. This data contains Rotten Tomatoes Tomatometer scores, Rotten Tomatoes Audience Scores, IMDb User Rankings, and Metacritic Scores. If you want to know how I processed the data in R and plotted the charts using ggplot2, I have prepared a screencast for your viewing pleasure.
For this analysis, we will be looking at the log-transformation of domestic box office revenue, since the values are skewed by mega-blockbusters like the ones mentioned previously. Revenues are not inflation-adjusted since the rating data is only present for recent years and due to the log-transformation already present, inflation correction would not impact this particular analysis much.
Rotten Tomatoes Tomatometer
After processing, I have a data subset of 4,863 movies with both Tomatometer and Box Office Gross values. Let’s plot all those movies on a scatterplot of log(BoxOffice) vs. Meter with each point having a slight transparency; that way, clusters of points will be come apparent where the areas are darker on the chart.
We expect a positive linear relationship: movies with high Tomatometer scores to have high box office revenue, and inversely movies with low score to have low box office revenue.
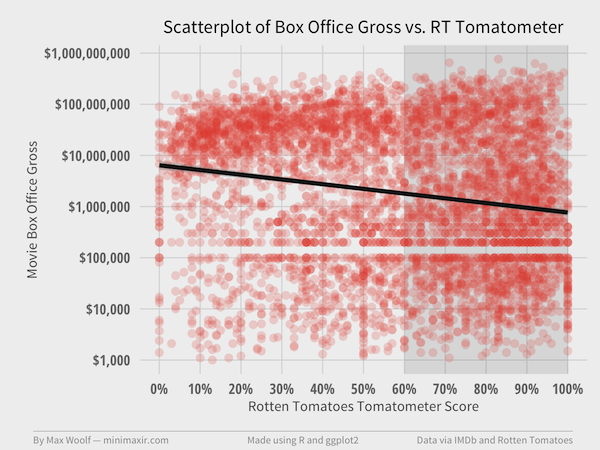
Wait, why does the trendline have a negative slope?
The Pearson correlation between the Tomatometer scores and log(BoxOffice) is -0.18, implying a weak negative linear relationship between the two variables. Not what I expected.
There do appear to be clusters in the data. There is a group of points between $10M and $100M revenue and 0% to 20% Tomatometer rating. Another group is present between $1,000 and $1M revenue and 80% to 100% RT rating. Both of these areas are outside of a linear relationship: perhaps these clusters are skewing trends too?
Let’s try another visualization of the data using contour maps, which allow the data to become 3D, so-to-speak. Using a 2D kernel density estimator, we can identify and color areas on the plot according to the number of points present in that area; the greater the color saturation, the more points present in the given area.
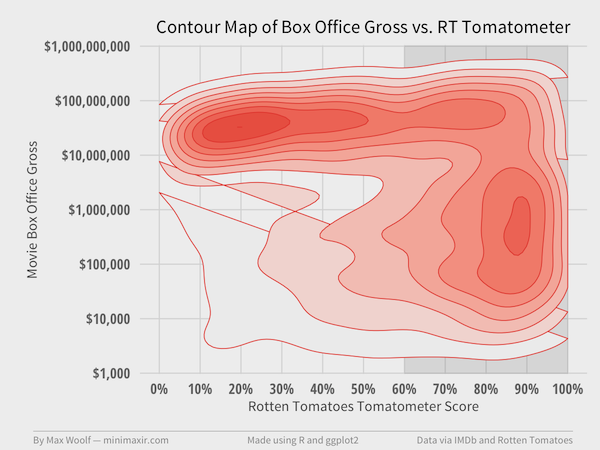
The two clusters mentioned previously are now much more apparent. It appears there are two distinct sets of movies: blockbusters which critics hate, and limited-appeal films which critics loves. Incidentally, there is no discernible difference between movies which are Fresh (>60%) and Rotten.
Metacritic
The Metacritic score is also derived from review data by critics; however, instead of calculating a binary review sentiment and calculating a proportion from that sentiment, Metacritic gives a quantification from 0 to 100 to each critic review and averages them together.
Does that change the results for 4,479 movies?
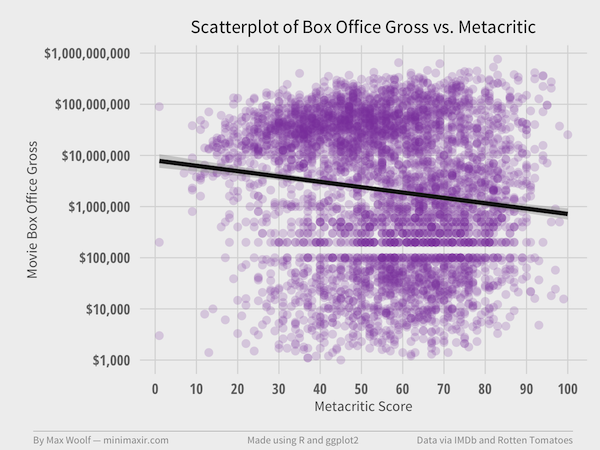
Correlation between Metacritic score and log(BoxOffice) is -0.13, which puts the analysis in a similar state as the Rotten Tomatoes data. However, the blockbuster cluster has shifted right, and the lesser-appeal cluster has shifted left.
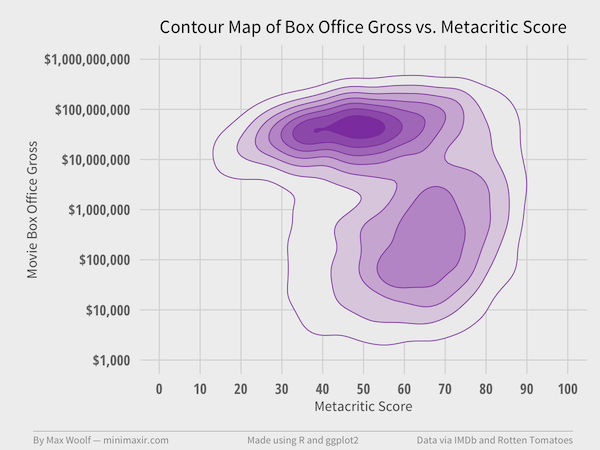
Clusters are much closer together.
Perhaps a review metric by non-critics will tell a different story.
Rotten Tomatoes Audience Score
The Audience Score is calculated in a similar way to the Rotten Tomatoes Tomatometer score: user to the site rate a movie from 0 to 5 stars in half-star increments (i.e. effectively a scale from 0-10) and the proportion of reviews with 3.5 star ratings or higher becomes the Audience Score.
This also presents a cognitive bias in ratings: the Four Point Scale, where having a discrete form of ranking may cause people to tend to rate toward the top of the scale and make the entire metric skewed or misleading.
How does the Audience Score compare for 5,163 movies? After all, the audience is the group of people who determine how much money a movie makes at the Box Office.
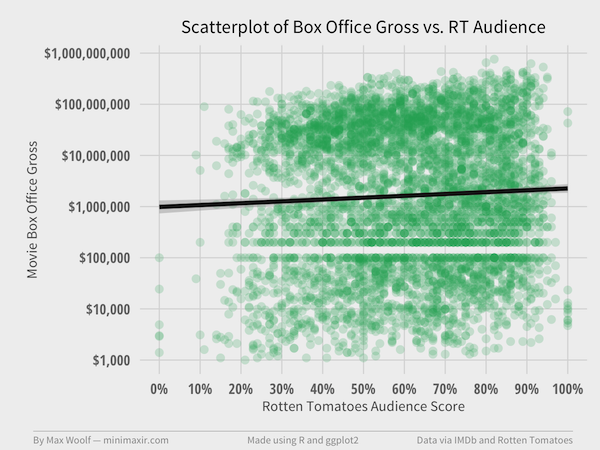
Correlation between the Audience score and log(BoxOffice) is 0.05, which is a positive linear correlation, but representative of barely any practical correlation.
Speaking of the Four Point Scale, notice how, like with Metacritic score, there are barely any movies between 0% and 20% Audience Score. Is there really a skew? Let’s look at the contours:
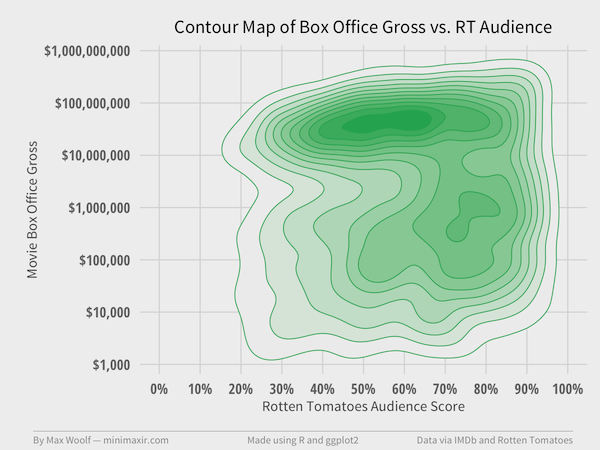
The locations of the clusters are much different than that of Tomatometer clusters. Both clusters are closer together, with the blockbuster cluster between 50% and 60% audience score and the lesser-appeal cluster between 70% and 80%. Hence, the low correlation.
IMDb
IMDb works almost the same way as the Metacritic for non-critics: ratings from IMDb users between 1-10 (note that 0 is missing!) are averaged to get a final score.
How do 5,167 movies fare?
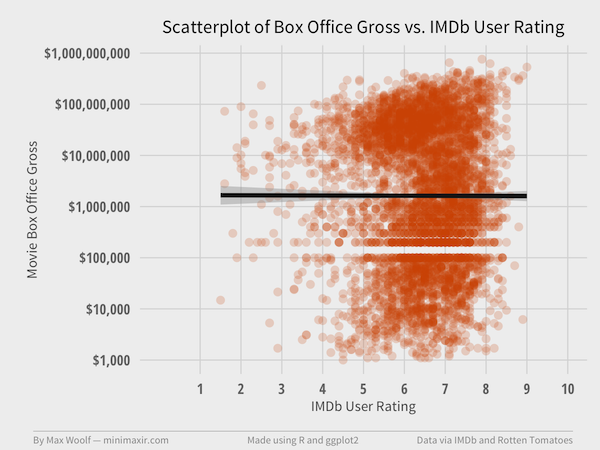
What?!
The point groupings are at the same positions of ratings, and the correlation between IMDb ratings and log(BoxOffice) is 0.00. Yes, there’s zero correlation!
Checking the contour map confirms it:
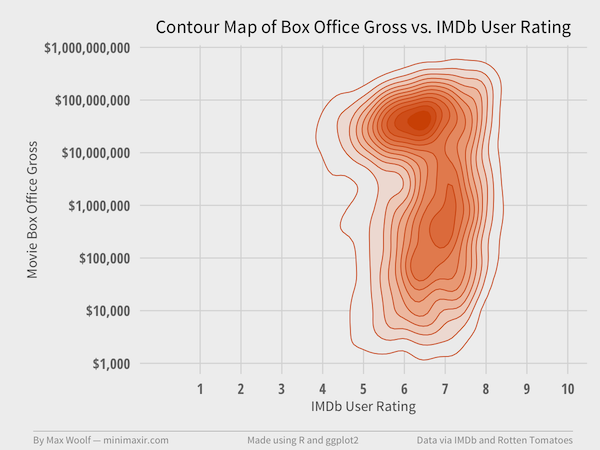
That is literally a Four Point Scale between 5 and 8!
The Rotten Tomatoes metric is the only metric that actually uses the entire rating scale. None of the other potential metrics provide more insight into a potential reason for high box-office revenue. Perhaps the movie rating system itself is broken.
That’s not to say that movies need high box-office revenues to be considered successful. However, working with movie profitability, and by extension movie budget, is opening another can-of-worms with respect to data integrity. (that said, on Reddit, /u/chartmkr recently posted a visualization of Gross vs. Budget which is interesting).
It’ll still be fun to point to a Rotten Tomatoes Tomatometer rating as a kneejerk reaction to whether a movie rocks/sucks. Although, the reasons for movie financial success at the box office definitely warrant further investigation.
UPDATE 1/11/15: On a discussion on Hacker News, it was suggested that the blockbuster movies and the indie movies cancel each other out, i.e. blockbusters have a positive correlation and indies have a negative correlation.
For the blockbuster cluster alone, the log-correlation is 0.23 (not weak but not great positive correlation). For the indie cluster alone, the log-correlation is -0.12 (same as original analysis).
For future analysis, it may be worthwhile to split these two clusters. I stand by the original analysis for this post: very frequently I’ve heard the question “is this a good movie?” and the response is “what does the RT score say?” Both Box Office revenues and RT scores are important measures of quality (depending on perspective), and users who want to see or purchase a movie may not necessarily care if it’s indie or a blockbuster.
User cwyers suggested that Simpson’s Paradox may be in play since the number of theaters showing a movie is positively correlated to box office revenue, adding a potentially-confounding affect. I will see if I can obtain that data for future analysis.
You can access the open-sourced Jupyter notebook and high-resolution charts from this article in this GitHub repository. If you use the code or data visualization designs contained within this article, it would be greatly appreciated if proper attribution is given back to this article and/or myself. Thanks!
Unfortunately, I cannot redistribute the data itself due to licensing concerns.
