Everyone enjoys taking photos of their Christmas trees, usually at their own home of their relatives. Instagram allows users to quickly upload any photo and share it socially to the world. On Christmas Eve, privacy author Tommy Collison published a warning about this behavior, noting that if a user tags a photo with #tree to tag their Christmas tree, for example, anyone will be able to see it, and if the user attached their location to the photo, anyone could theoretically find where they live.
How practical is this concern? Instagram offers an API of all recent photos for a given #tag so developers can download pictures and their corresponding metadata, such as geolocation, in bulk. (Up to 165,000 Instagram images can be processed per hour!)
I downloaded hundreds of thousands of #tree images and found 25,432 images which were taken on Christmas, have a #tree, and, most importantly, contain location data where the photo was taken. From that, I created an interactive map showing the location of all these images worldwide using Google Fusion Tables. You can click-and-drag to move the map all over the world, and you can click on a marker on the map to see the Instagram image taken at that location! (note that if you’re on a mobile device, the embedded map may work better on a desktop browser)
I found a few interesting things while playing with this map.
Christmas Trees in the USA
A downside of the interactive map is that quantifying the relative number of photos between dense areas (e.g. cities) can be misleading as the opaque markers overlap. Here is a static map of all of the Instagram photos in the United States, with each translucent point representing an image:
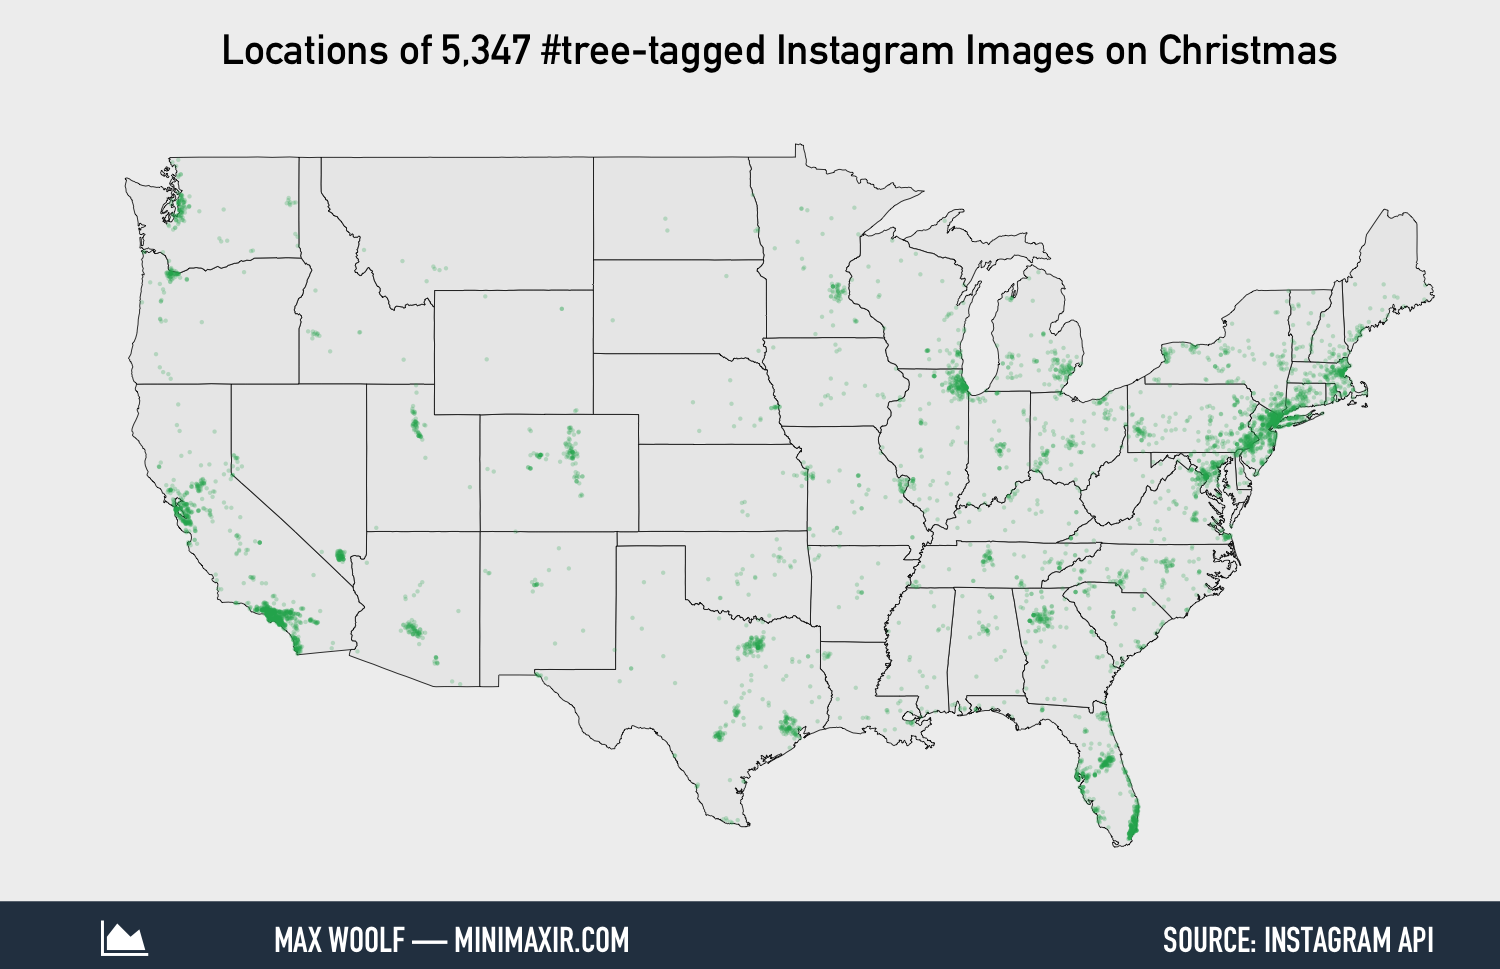
The number of photos is densest near the large cities, which is what you would expect.
A way to calculate the relative proportion of the number of #tree photos between states is to use a type of chart known as a treemap (pun very much intended).
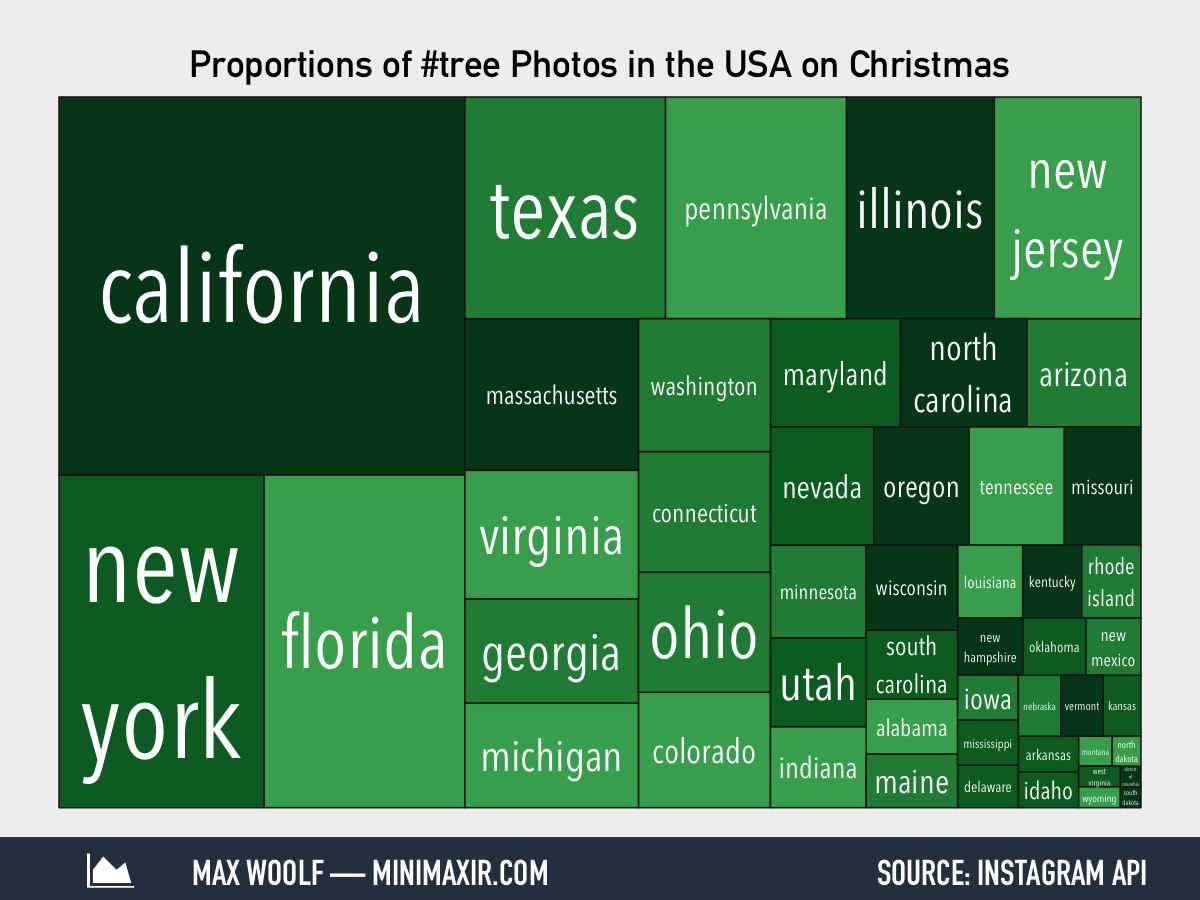
In this treemap, the relative area of each block corresponds to the number of photos taken in the state; therefore, the combination of all the blocks represents 100% of the #tree photos taken in the USA. If two blocks are the same size (e.g. New York and Florida), then they have the same number of #tree photos.
As you may have noticed from these two charts, these data represented by these two charts is approximately the same as the population density in the United States. Although this touches on the infamous statistical problem of heat maps resembling population maps, in this case, it’s what would be expected.
Looking at all the #tree photos in the world may tell a different story.
Christmas Trees in the World
Christmas is a holiday for only one religion with a low presence in Asia and northern Africa, so it would be expected that the locations of Christmas trees worldwide do not correlate with population, which makes the analysis more interesting.
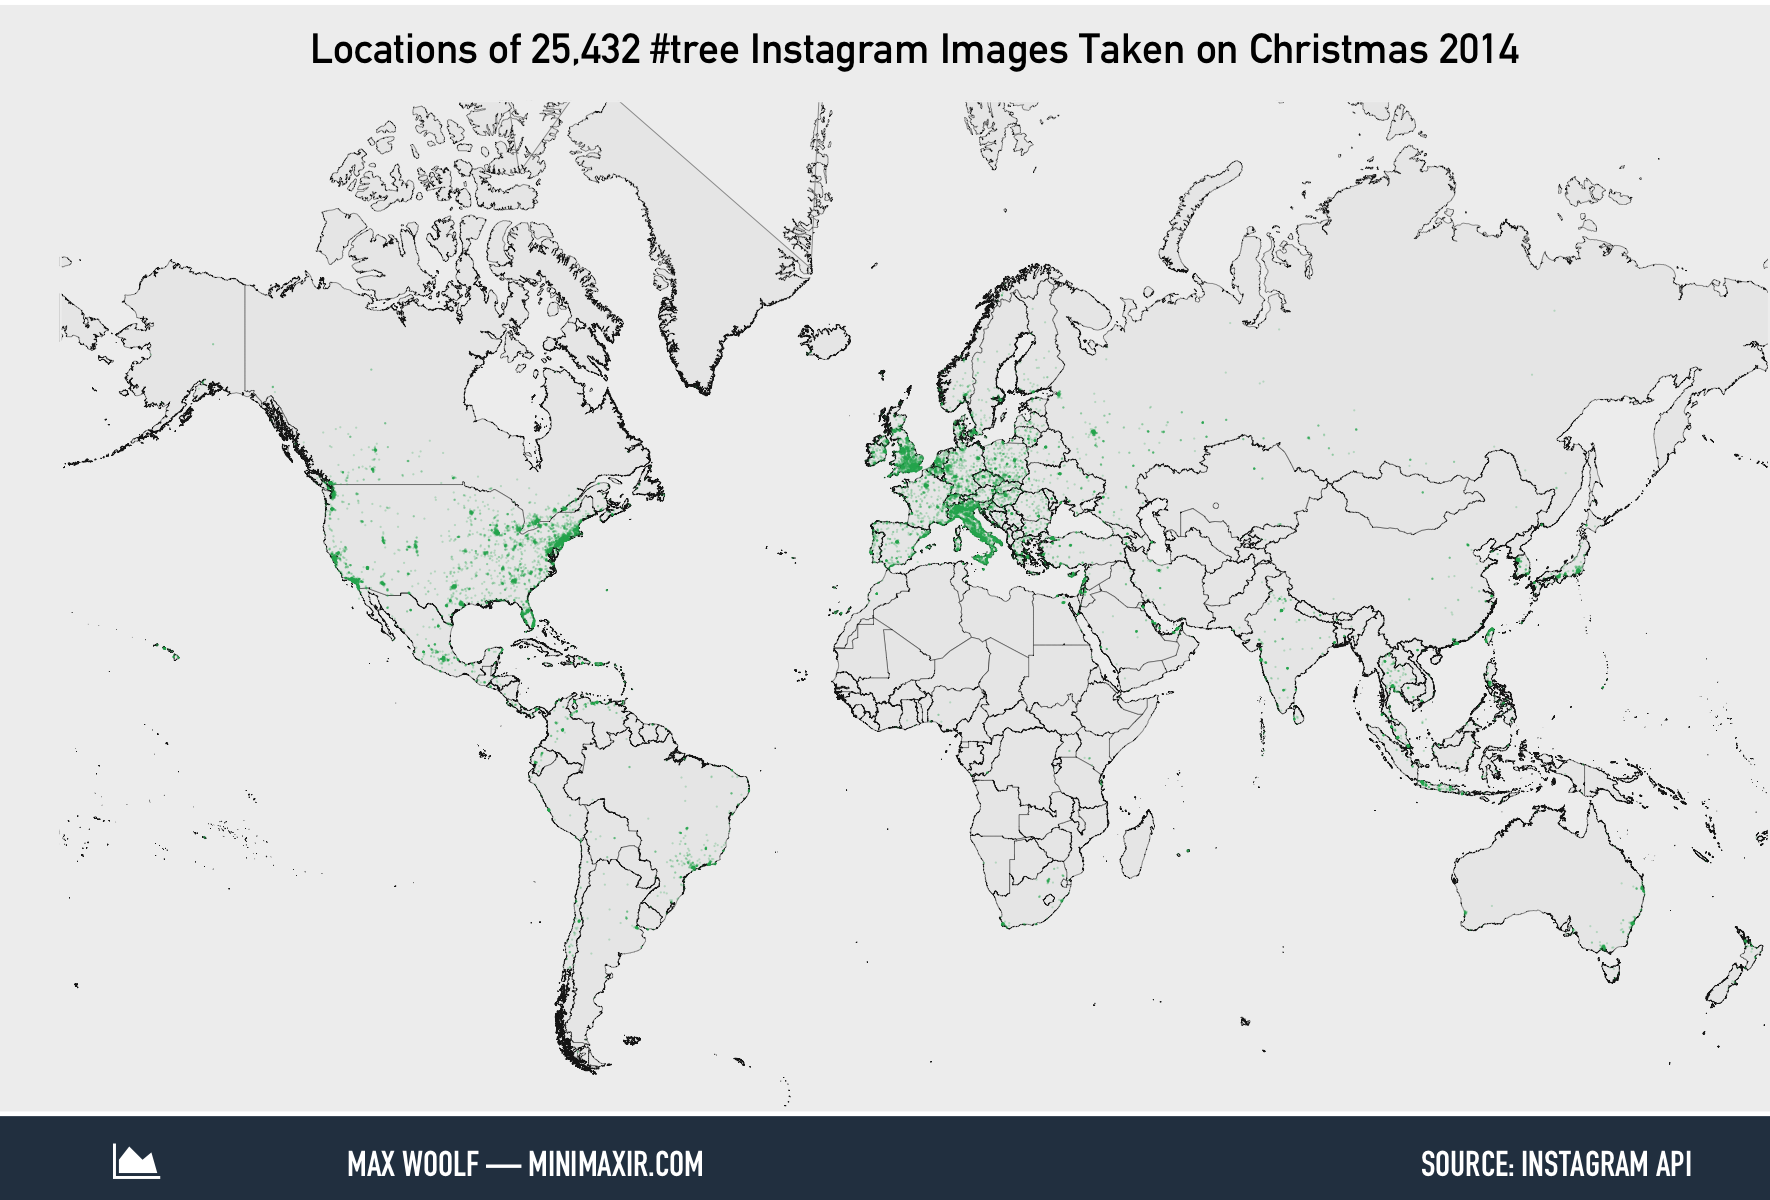
The prevalence of Christmas trees is most prominent in the United States and Europe, with relatively few in Asia, where the majority of the world’s population is located. Italy has Christmas trees uniformly throughout the entire country, which is an interesting behavior.
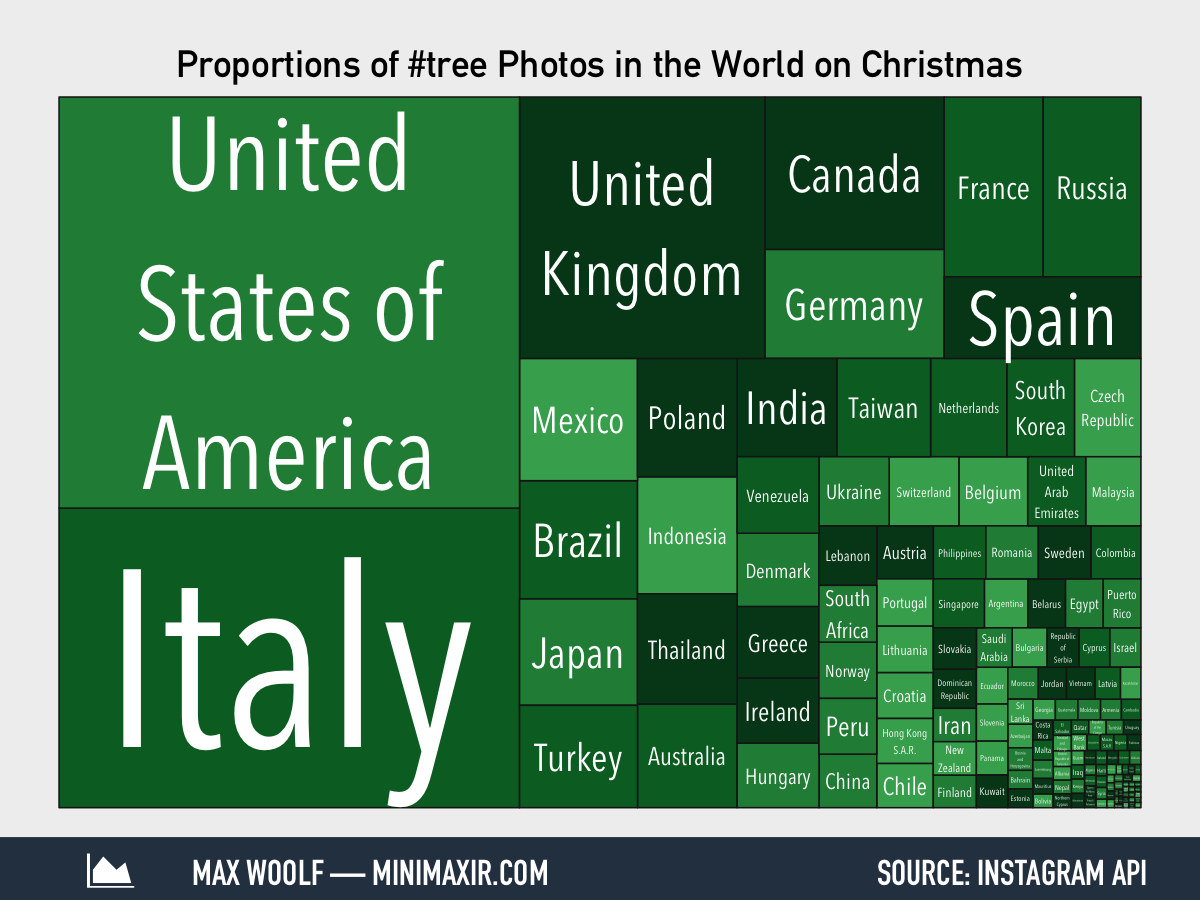
The treemap confirms that Asian and African countries like China, India, and Nigeria do not have as many Christmas trees than what their large populations would suggest. Italy, however has a population of 60 million (the same as the United Kingdom) which is about 1/5th of the population of United States; the fact that Italy has more than half of the number of Christmas Trees than the United States is very unusual and should be questioned.
Italy may have a high number of Christmas trees since Vatican City is the seat of the papacy, but perhaps data itself should be questioned too.
“Christmas Trees” in the World
If you check the photos in Italy, you many notice that many of them have a photo caption similar to this one:
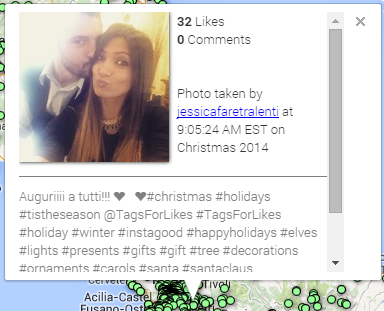
There’s obviously no Christmas tree in that photo. But there are a lot of tags.
Many Instagram photos use a service called TagsForLikes, which complies a list of popular hashtags that other users are able to see. Users can then then copy/paste them into the photo caption to spam hashtags increase the photo exposure, which, as I’ve shown in a previous blog post, does in fact increase the number of Likes the photo receives from other users.
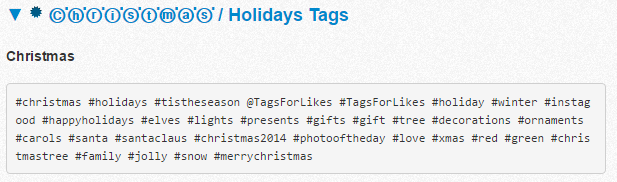
Notice a resemblance between this list and the photo caption?
Fortunately, all the TagsForLikes hashtag lists contain #TagsForLikes as a branding trick, which makes such photos extremely easy to detect. Here’s what the world map looks like if all the potentially spam photos were colored red:
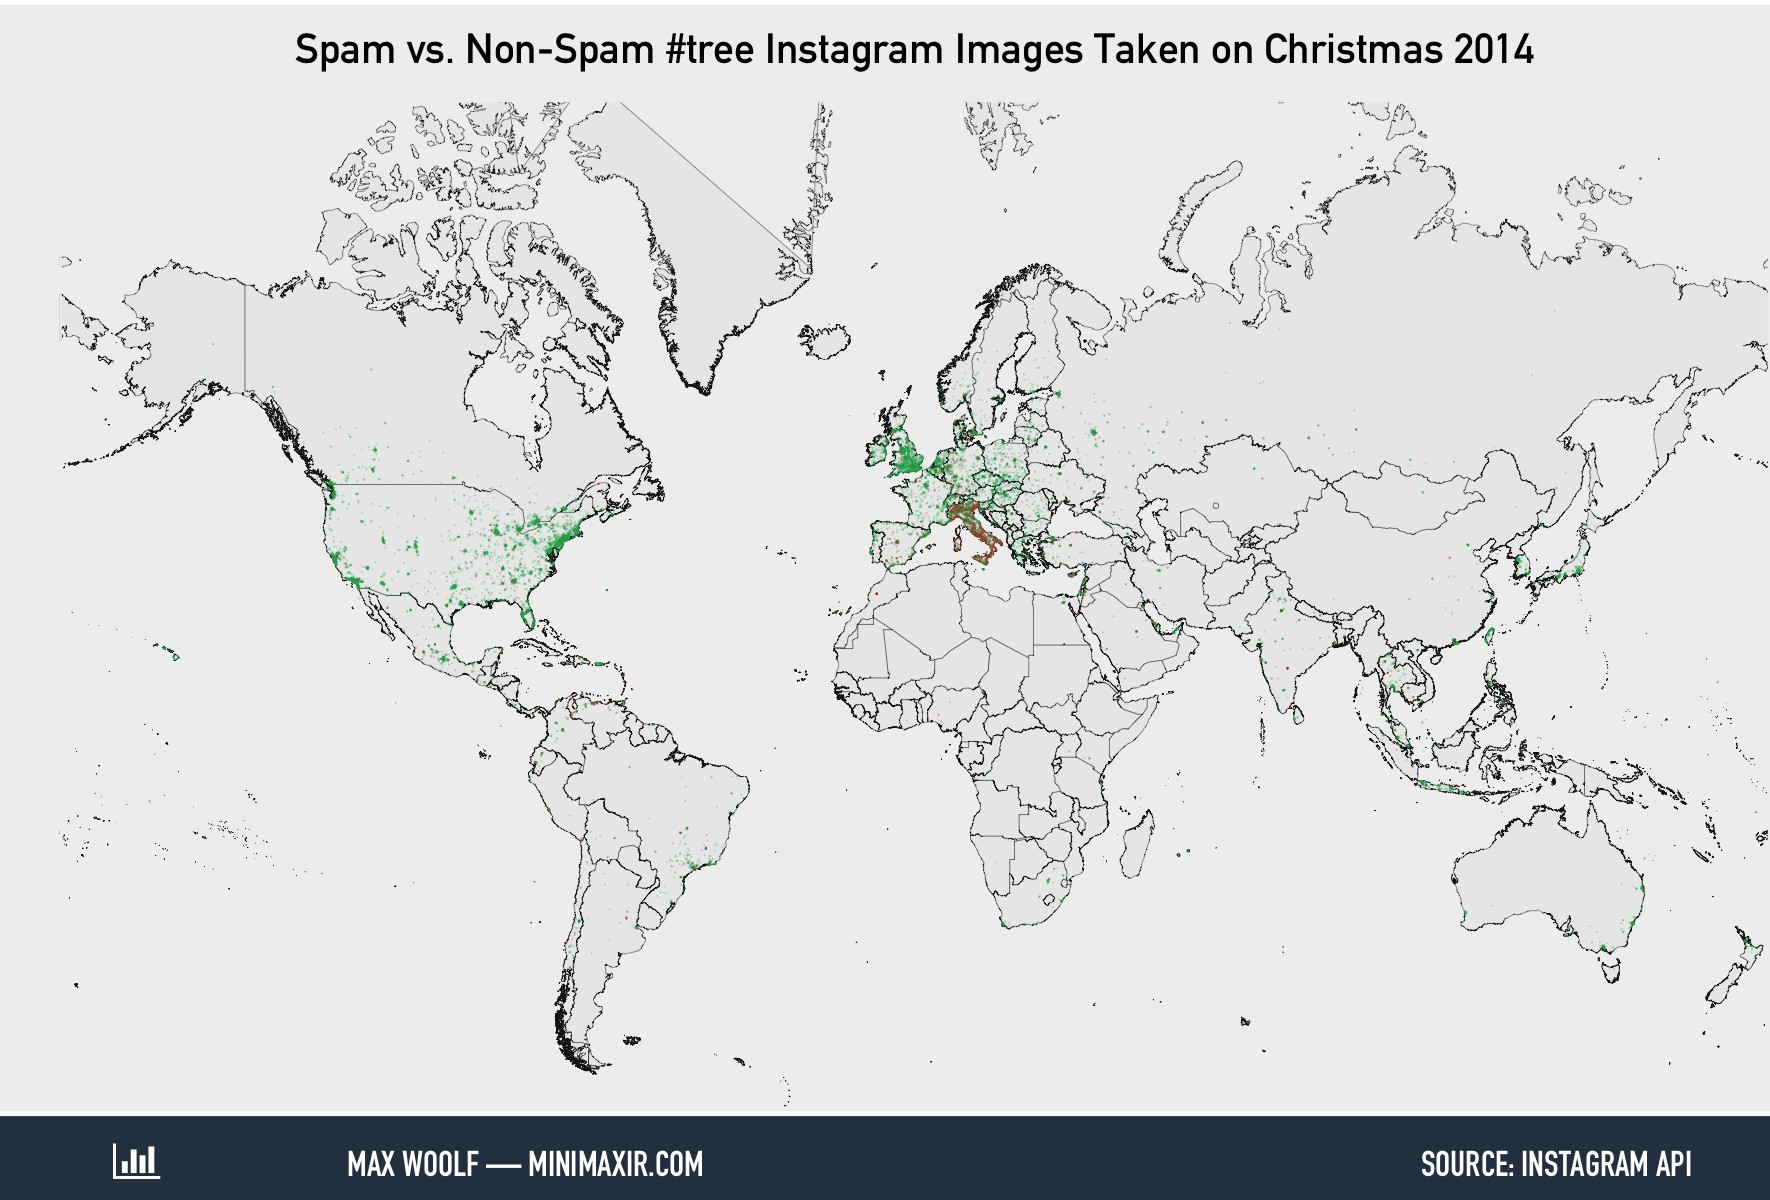
Italy looks a lot different now! There is red in other counties, but it’s not easily visible at a glance.
The treemap of photos, when seperated between spam and non-spam photos, tells the full story:
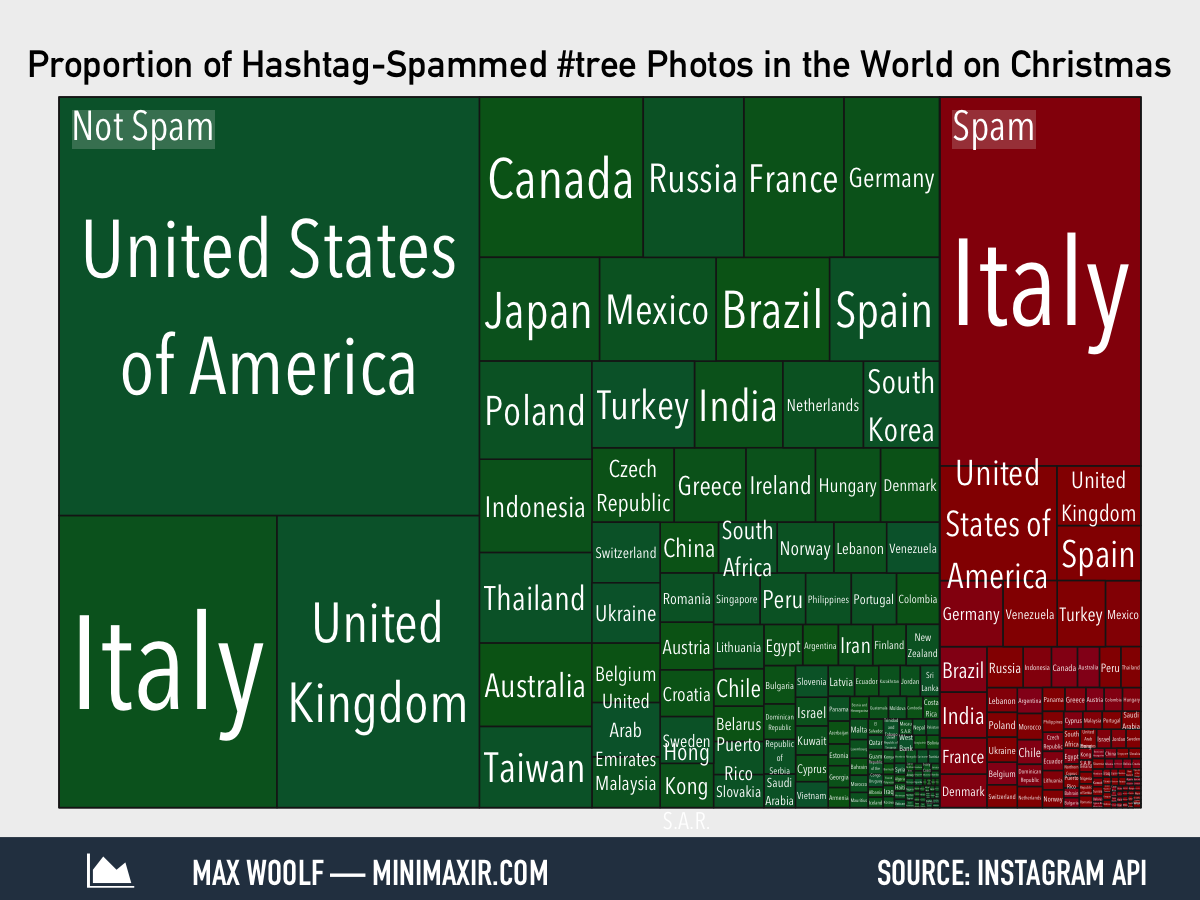
About 20% of all the #tree photos are spam photos, and about half of those were taken by people in Italy. As a result, Italy has more spam #tree photos than nonspam #tree photos! This is an interesting cultural phenomenon that I have no guesses as to why it occurs. All other countries have significantly smaller numbers of spam photos relatively non-spam photos.
For non-spam photos, the number of #tree photos in Italy now matches the number of non-spam photos in the UK, which correlates with their populations, making the removal of spam photos a sane move.
Is it possible to track people in their homes via Instagram tags? Definitely. If you do care privacy and your Instagram account is not set to Private, I recommend not geotagging your photos. If you’re interested in looking at such photos, ensure that the the tag is relevant for the given photo.
All graphics were generated using R. The maps were created using ggplot2 and the world map provided with the rworldxtra package. The treemaps were created using the treemap package.
The source data is included with a seperate tab in Google Fusion Tables along with the interactive map.
