Hacker News, a tech-oriented link aggregator managed by Y Combinator, is a platform where software projects have launched to literally become multibillion-dollar companies. Submissions which contain the phrase “Show HN” usually designate a clever hack or weekend project. On July 3rd 2014, Hacker News created a section of Hacker News just for these Show HN projects.
Did this feature help or harm Show HN submissions as a whole?
Over the past few years, the average number of Show HN submissions per day has steadily risen. (this is strongly correlated with the growth of Hacker News as a whole)
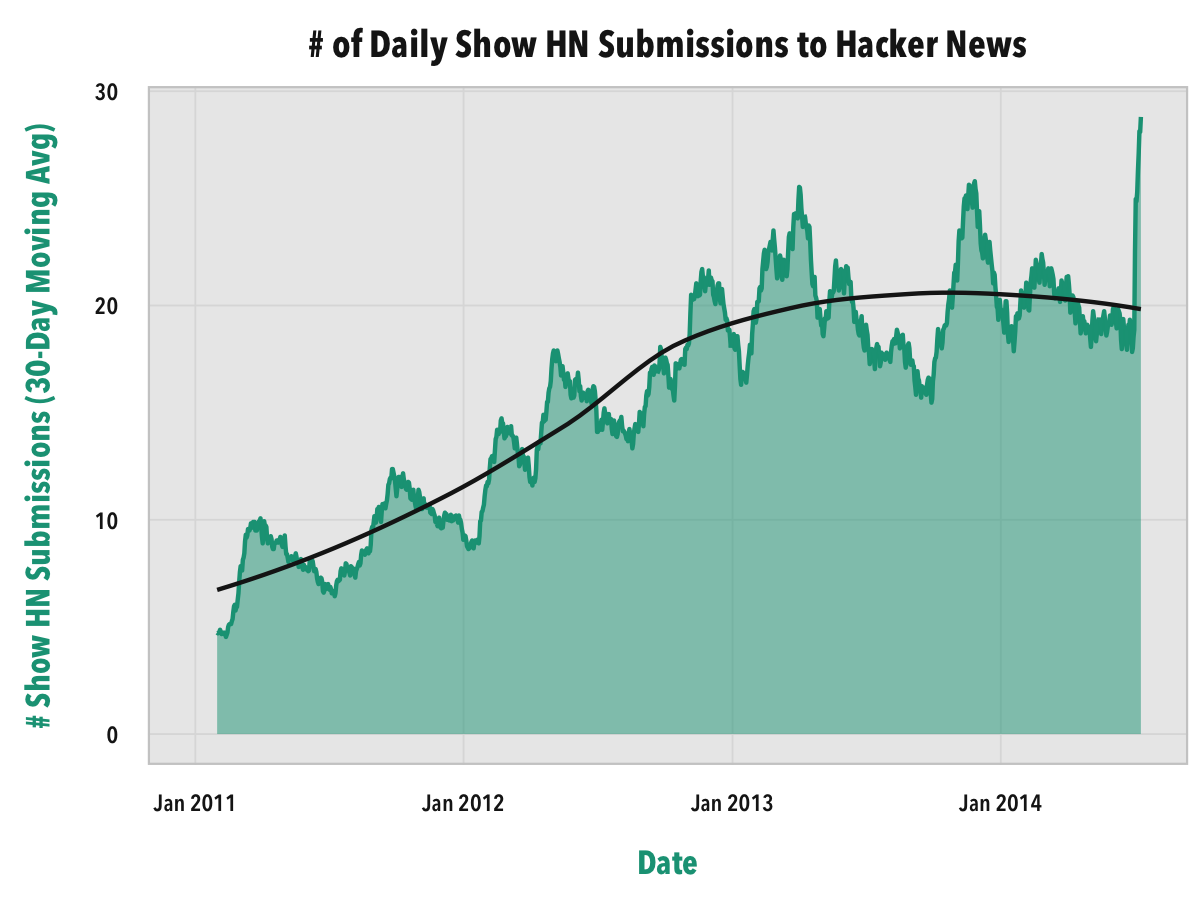
More on that spike at the end later.
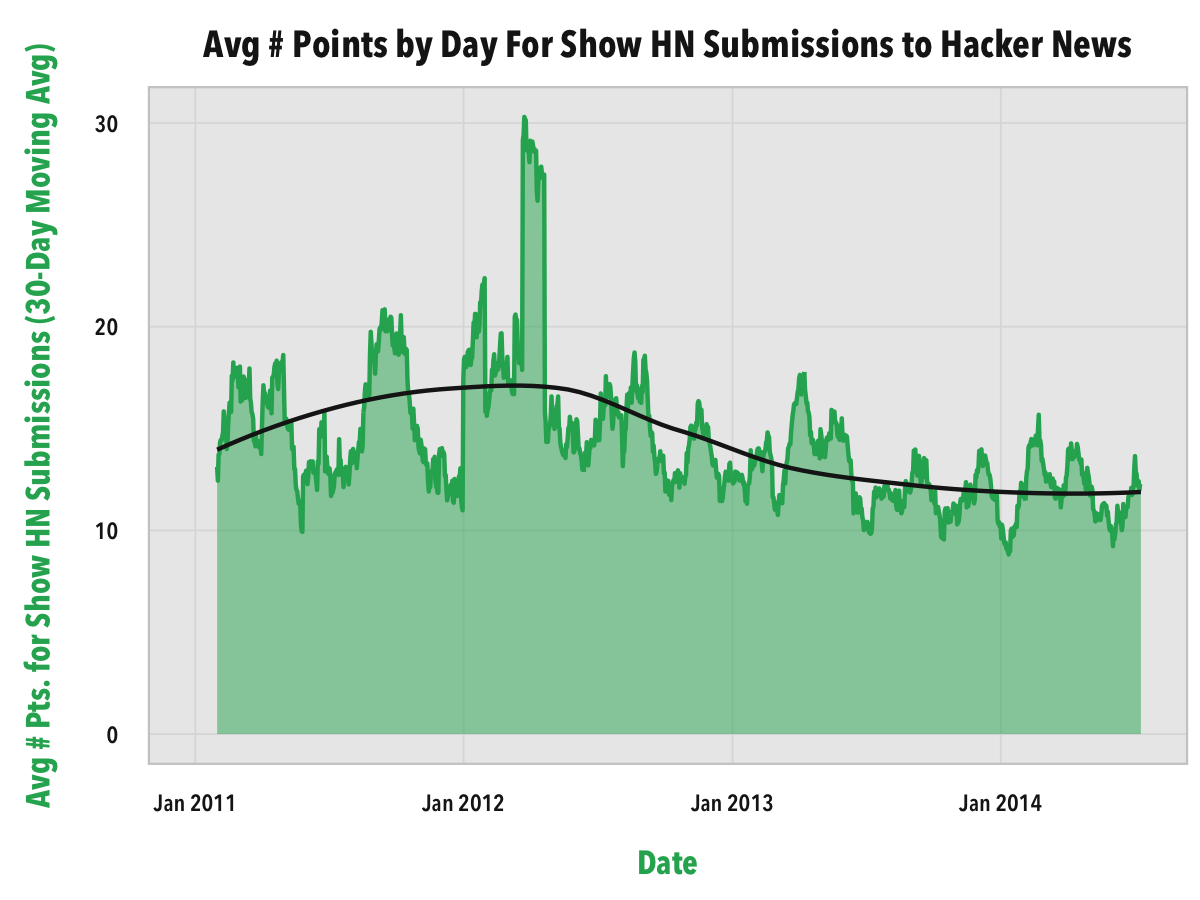
On Hacker News, users can upvote link submissions, which increases the point score of the submission; this point score is used as a rough proxy of link quality. The average amount of points per submission peaked in 2012, and has trended downward since then.
Here’s a chart of the points of Show HN submissions averaged by date of submission, then averaged across the previous 30-days to further smooth the variation and make the trend more apparent:
Users can also comment on these Show HN posts. The average amount of comments has trended downward over time, albeit only slightly.
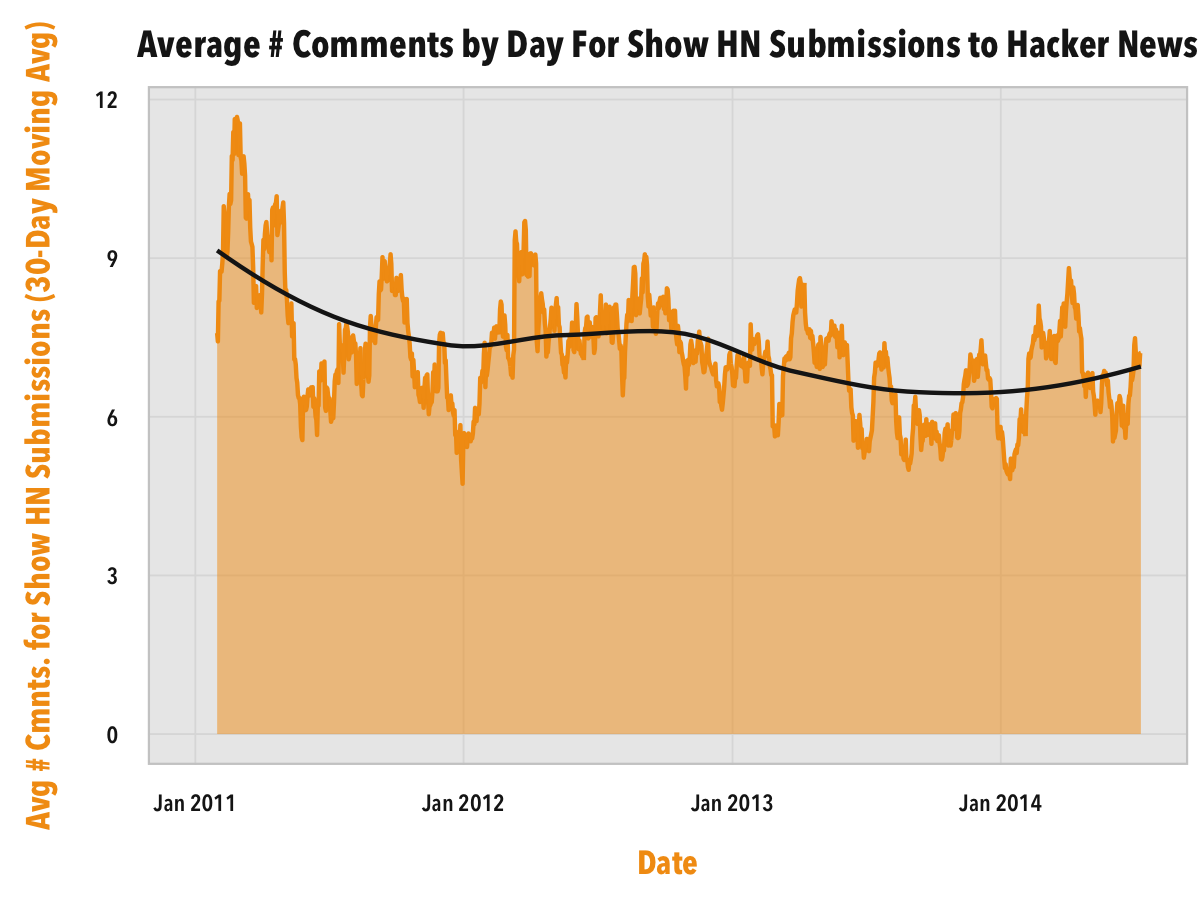
The combination of increased Show HN submissions and a decrease in point quality over time may imply that Show HN submissions have a low signal-to-noise ratio, i.e. a low amount of good submissions relative high amount of bad submissions.
Hitting the front page of Hacker News is the first step to virality. When users upvote submissions on Hacker News, those submissions can hit the front page after achieving enough points (combined with other factors, such as submission age and quantity of other submissions). At the least, if a submission has 10 points, it has most likely hit the front page sometime in its lifespan.
What proportion of the Show HN submissions hit the front page?
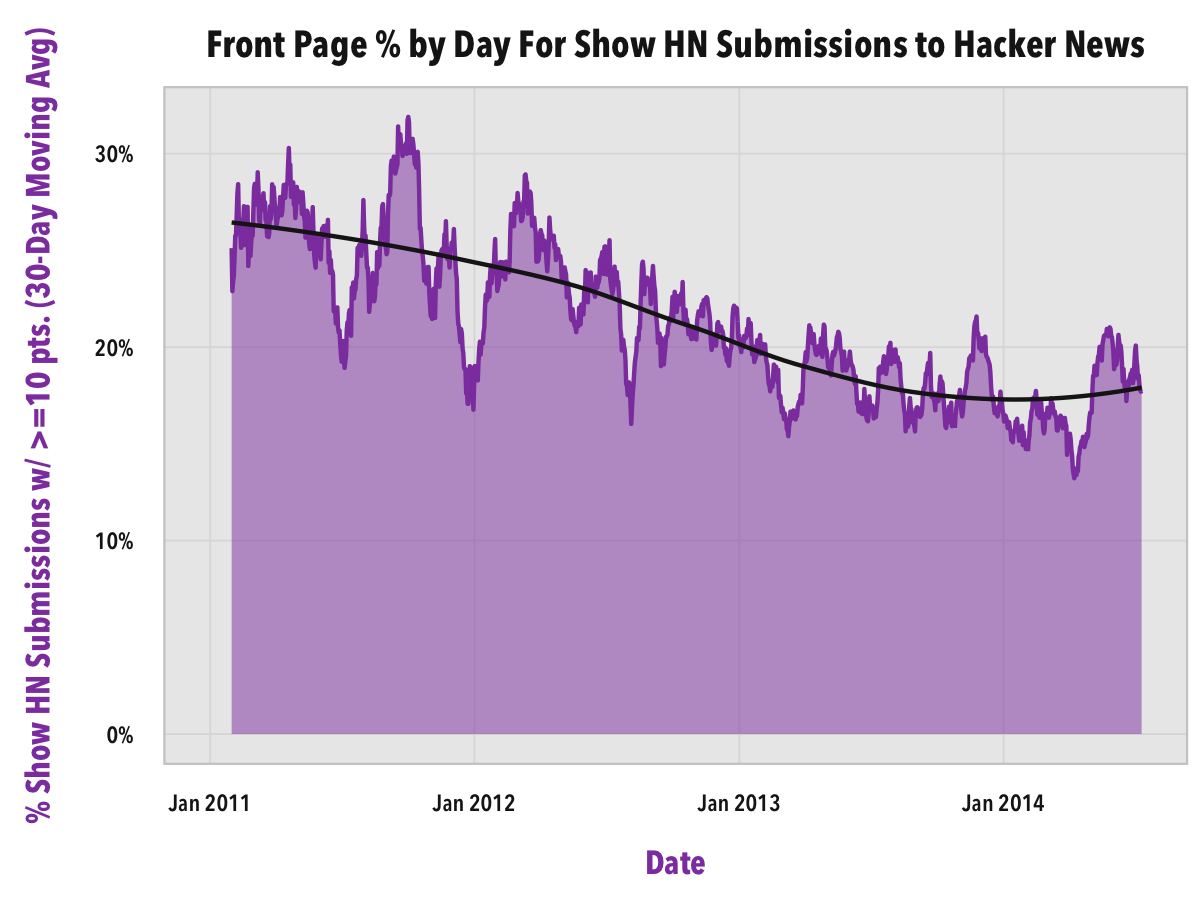
Over time, the amount of good Show HNs relative to the amount of bad Show HNs has been steadily decreasing.
Has the new Show HN feature helped improve the signal-to-noise ratio?
Show and Tell HN
We can look at the immediate impact of the new Show HN section by comparing the behavior of submissions before and after the announcement. The red area in the following charts represents the daily behavior in the couple months before the release (with the red horizontal dotted line representing the statistical average for the corresponding measurement), and the blue area/blue line represents the behavior after the release.
When the Show HN feature was first announced, everyone rushed to make a submission to test it out, and it showed. In fact, the number of submissions for every day after the feature was added was greater than the average number of submissions from before the addition.
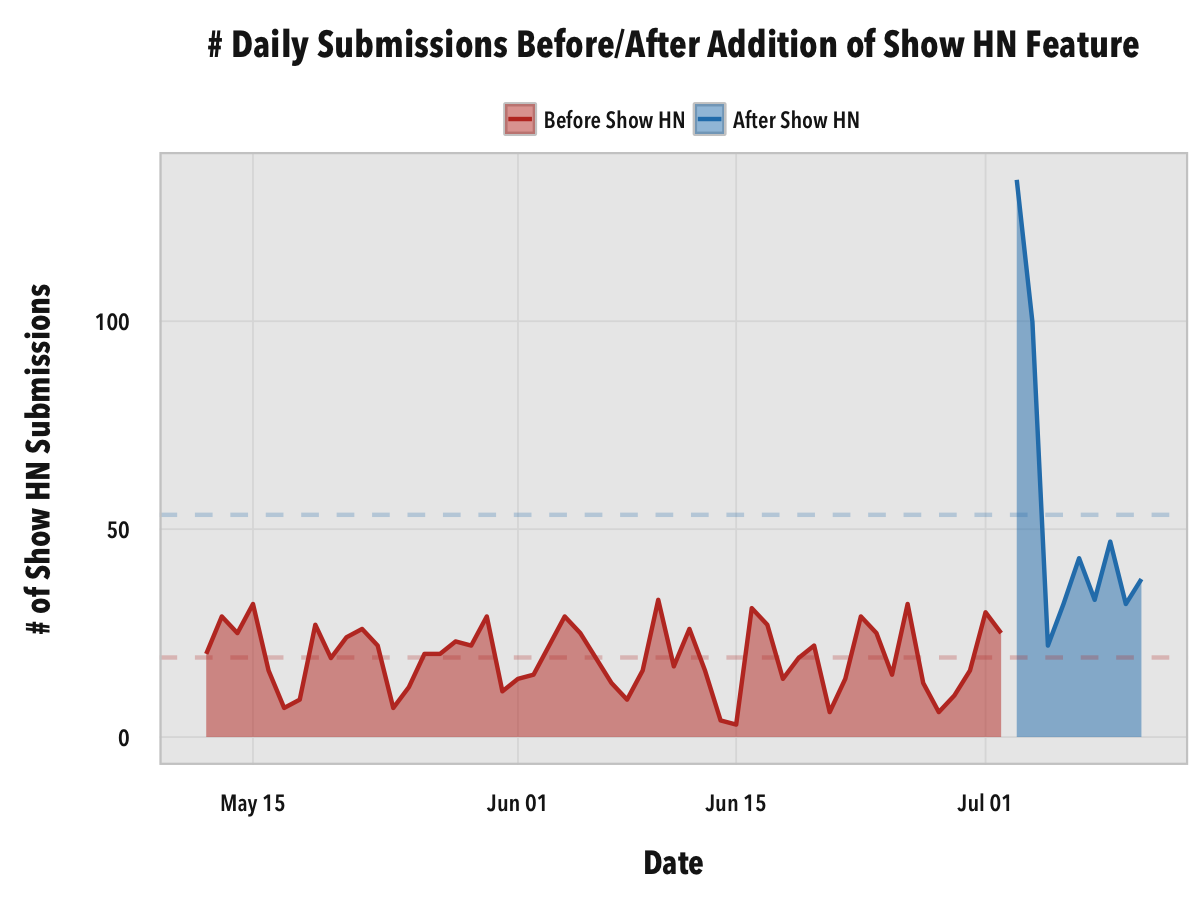
Average number of daily submissions before Show HN section is 19.13 submissions/day, average after is 53.44 submissions/day.
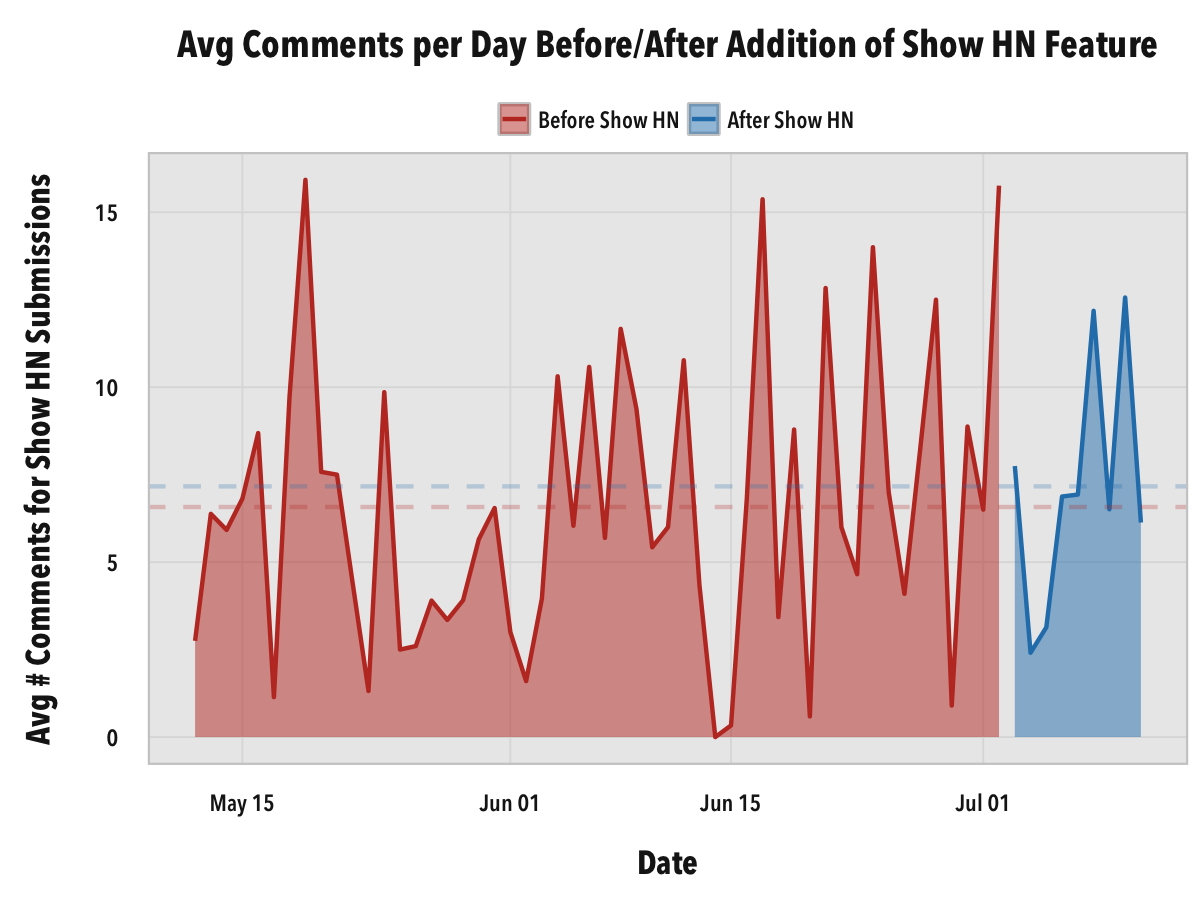
Average submission points and average submission comments (both aggregated by date of submission for smoothing) received a slight boost too.
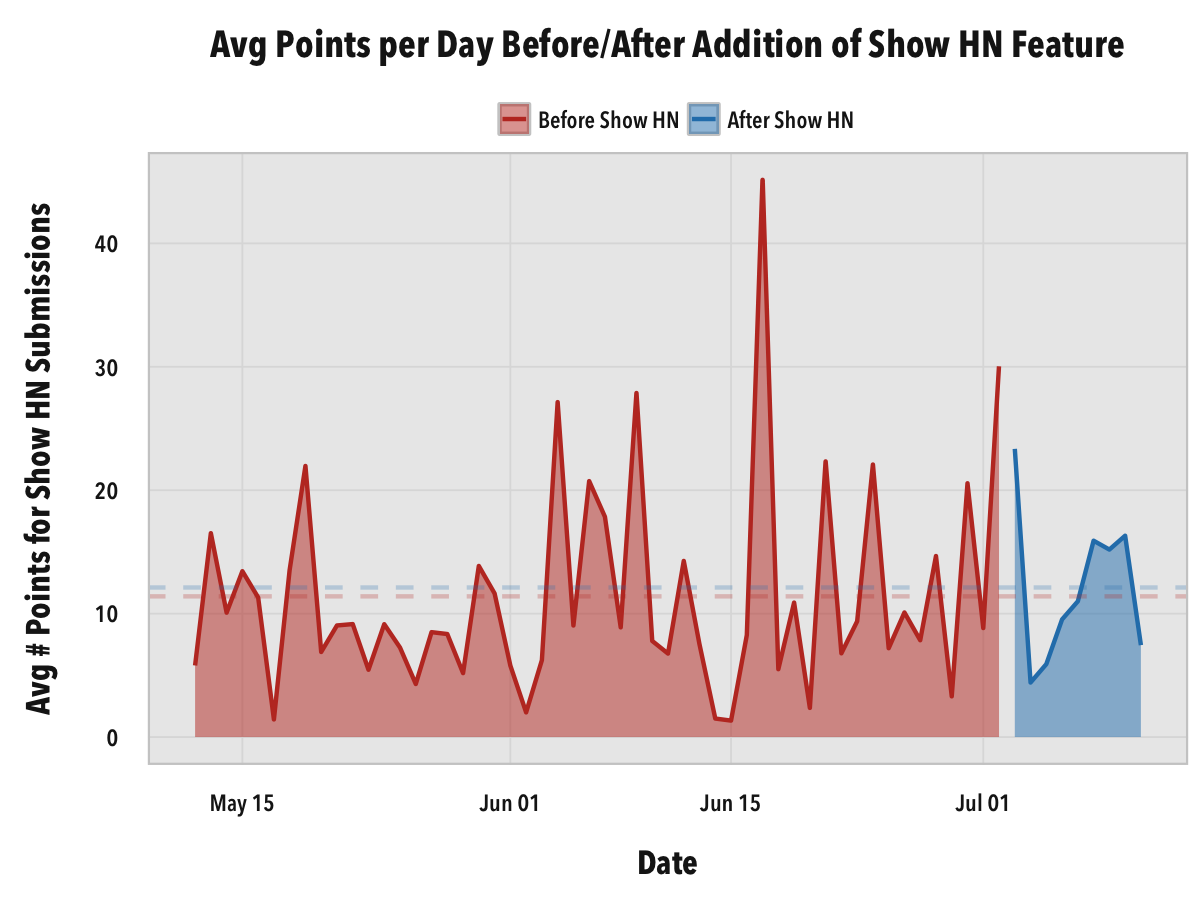
Average number of daily points before Show HN section is 11.40 points/submission/day, average after is 12.12 points/submission/day.
Average number of daily comments before Show HN section is 6.57 comments/submission/day, average after is 7.16 comments/submission/day.
The percentage of Show HN submissions that hit the front page, however, moves in a different direction.
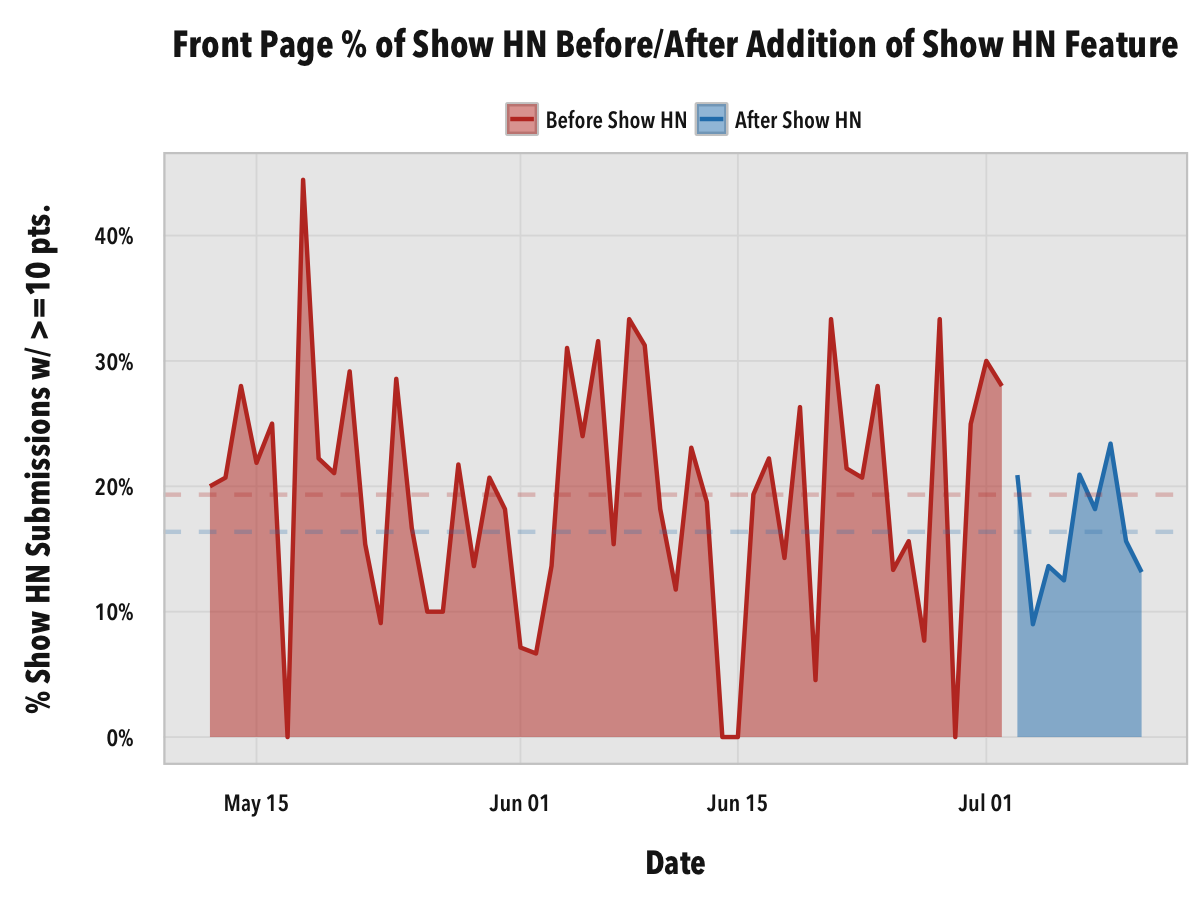
Average daily % of Show HN submissions which hit the front page before Show HN section is 19.33%, average after is 16.37%.
While the Show HN section gives more focus to Show HN submissions, the increased motivation for making Show HN submissions does not necessarily imply that the submissions will be better. It will take more time to see of the downward trend of Show HN quality continues over time.
- Data was processed using R and all charts were made using ggplot2.
- You can view the data of all the Show HN submissions and the derived moving averages in this Google Sheet.
- You can view code necessary to reproduce these results and reproduce all the charts in this GitHub repository. This repository also includes a .csv of all ~20,000 Show HNs obtained.
