When buying the latest products on Amazon, reading reviews is an important part of the purchasing process.


Customer reviews from customers who have actually purchased and used the product in question can give you more context to the product itself. Each reviewer rates the product from 1 to 5 stars, and provides a text summary of their experiences and opinions about the product. The ratings for each product are averaged together in order to get an overall product rating.
The number of reviews on Amazon has grown over the years.
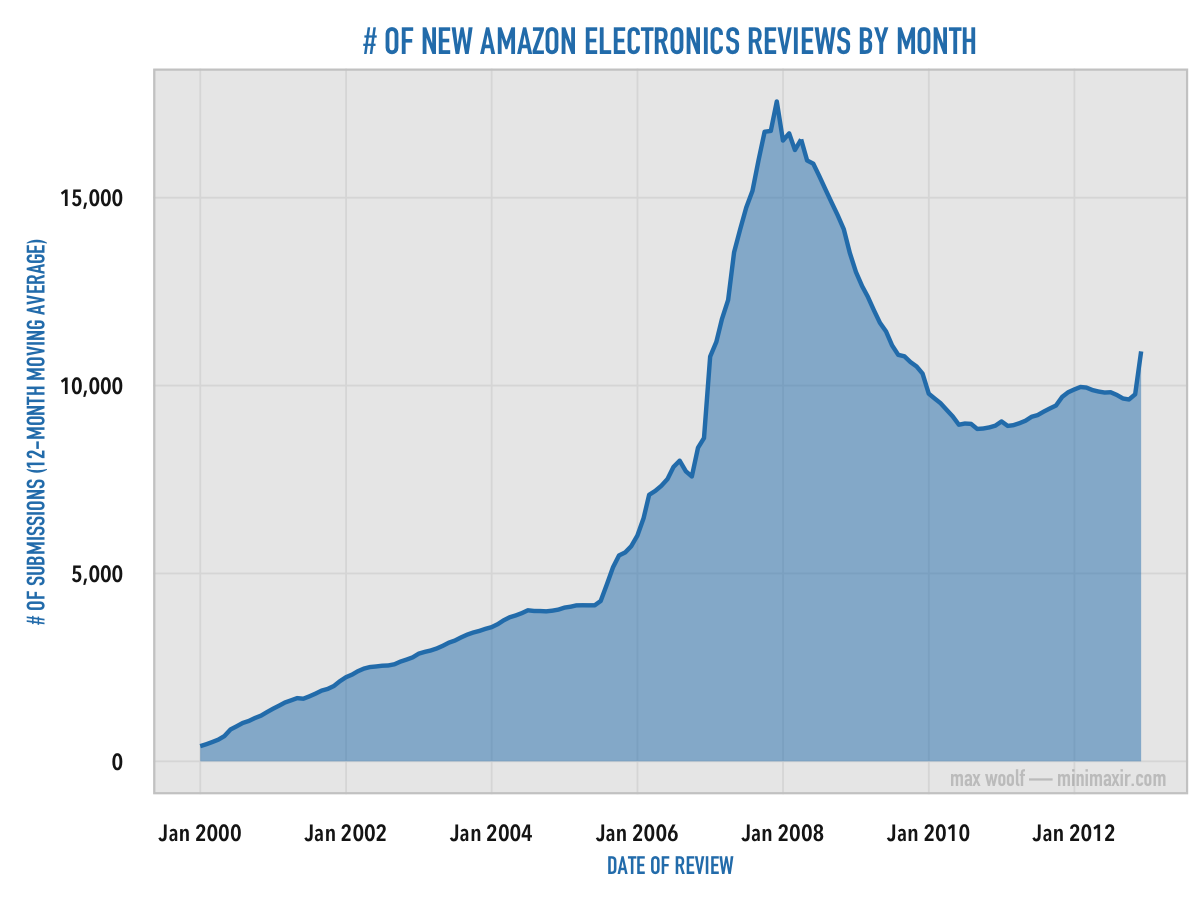
But how do people write reviews? What types of ratings do reviewers give? How many of these reviews are considered helpful?
Stanford researchers Julian McAuley and Jure Leskovec collected all Amazon reviews from the service’s online debut in 1995 to 2013. Analyzing the dataset of 1.2 million Amazon reviews of products in the Electronics section, I found some interesting statistical trends; some are intuitive and obvious, but others give insight to how Amazon’s review system actually works.
Describing the Data
First, let’s see how the user ratings are distributed among the reviews.
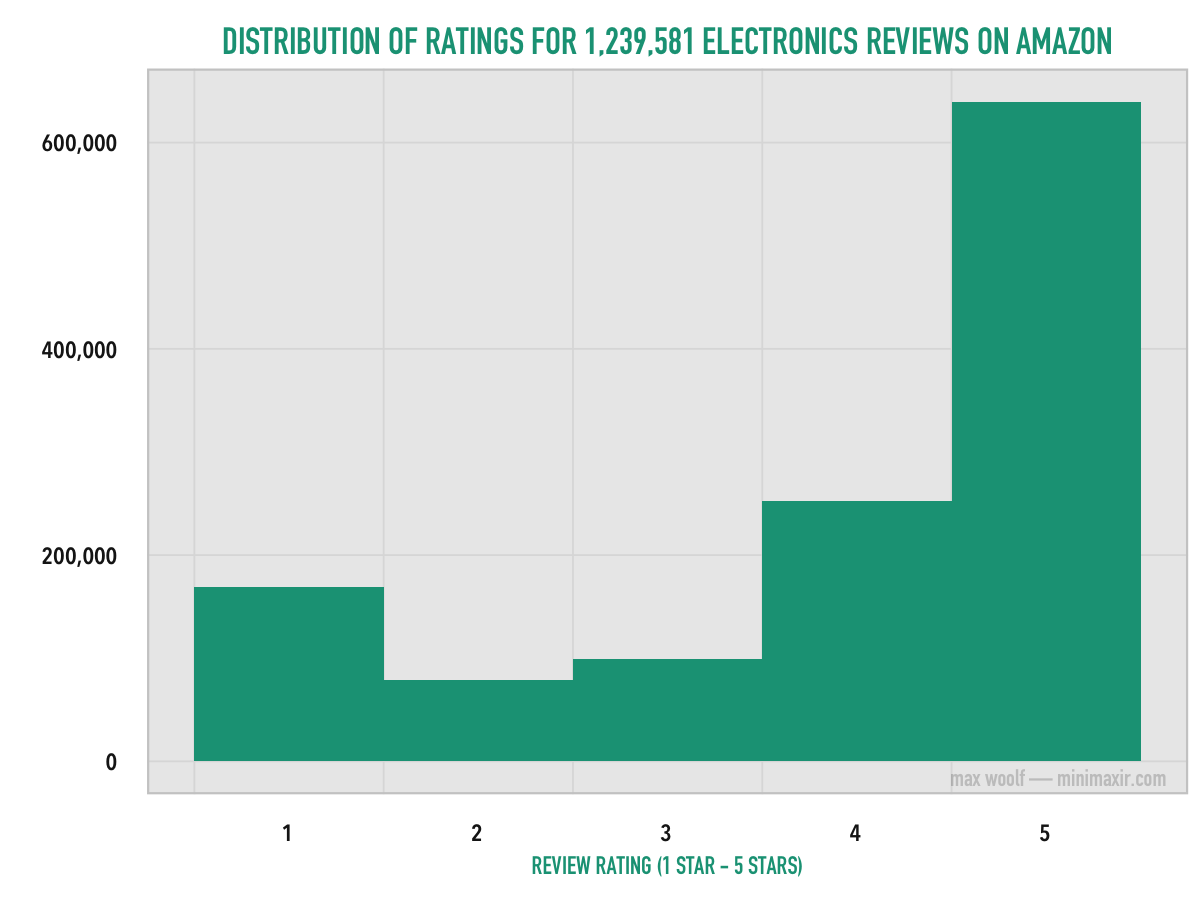
More than half of the reviews give a 5-star rating. Aside from perfect reviews, most reviewers give 4-star or 1-star ratings, with very few giving 2-stars or 3-stars relatively.
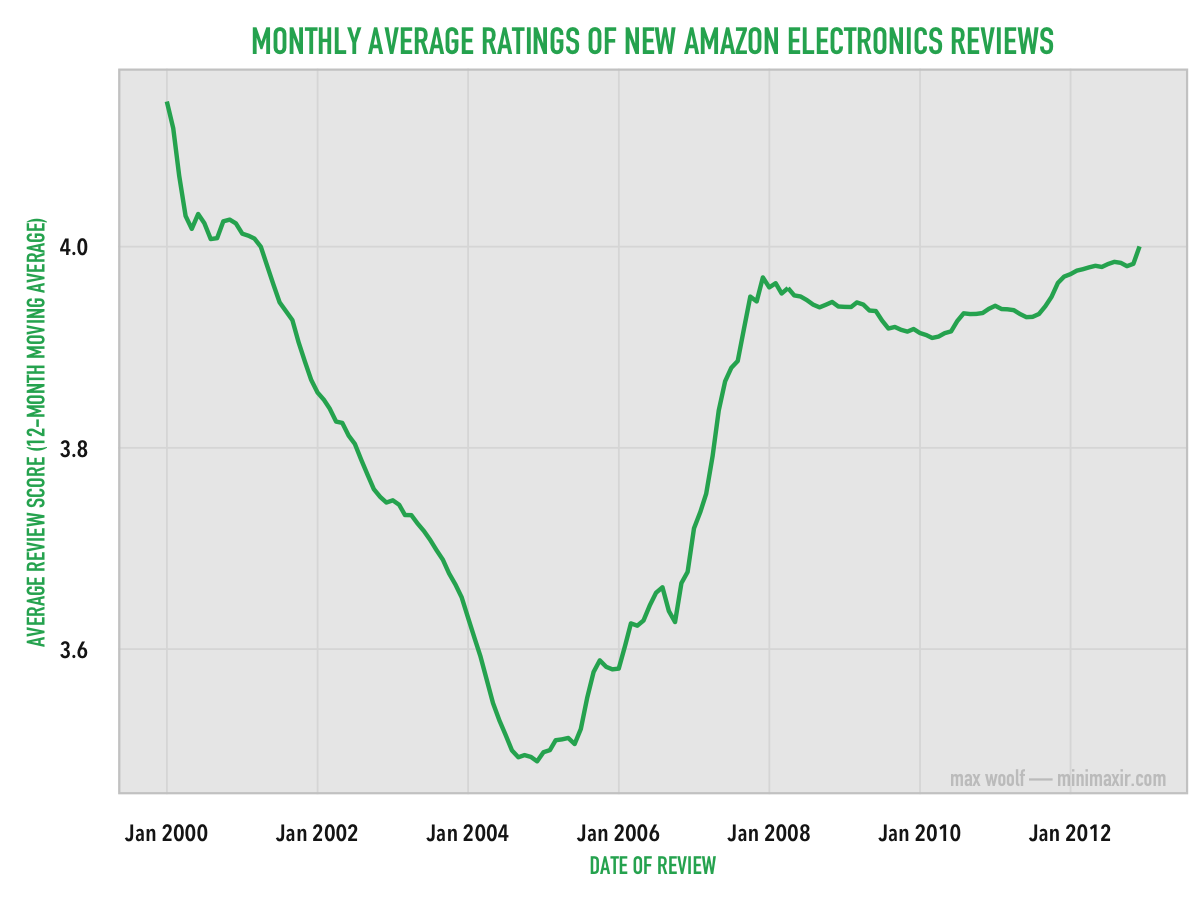
As as result, the statistical average for all review ratings is on the high-end of the scale at about 3.90. In fact, the average review rating for newly-written reviews has varied from 3.4 to 4.2 over time.
Another metric used to measure reviews is review helpfulness. Other Amazon reviewers can rate a particular review as “helpful” or “not helpful.” A “review helpfulness” statistic can be calculated by taking the number of “is-helpful” indicators divided by the total number of is-helpful/is-not-helpful indicators (in the example at the beginning of the article, 639/665 people found the review helpful, so the helpfulness rating would be 96%). This gives an indication of review quality to a prospective buyer. Only 10% of the reviews had atleast 10 is-helpful/is-not-helpful data points, and of those reviews, the vast majority of the reviews had perfect helpfulness scores.
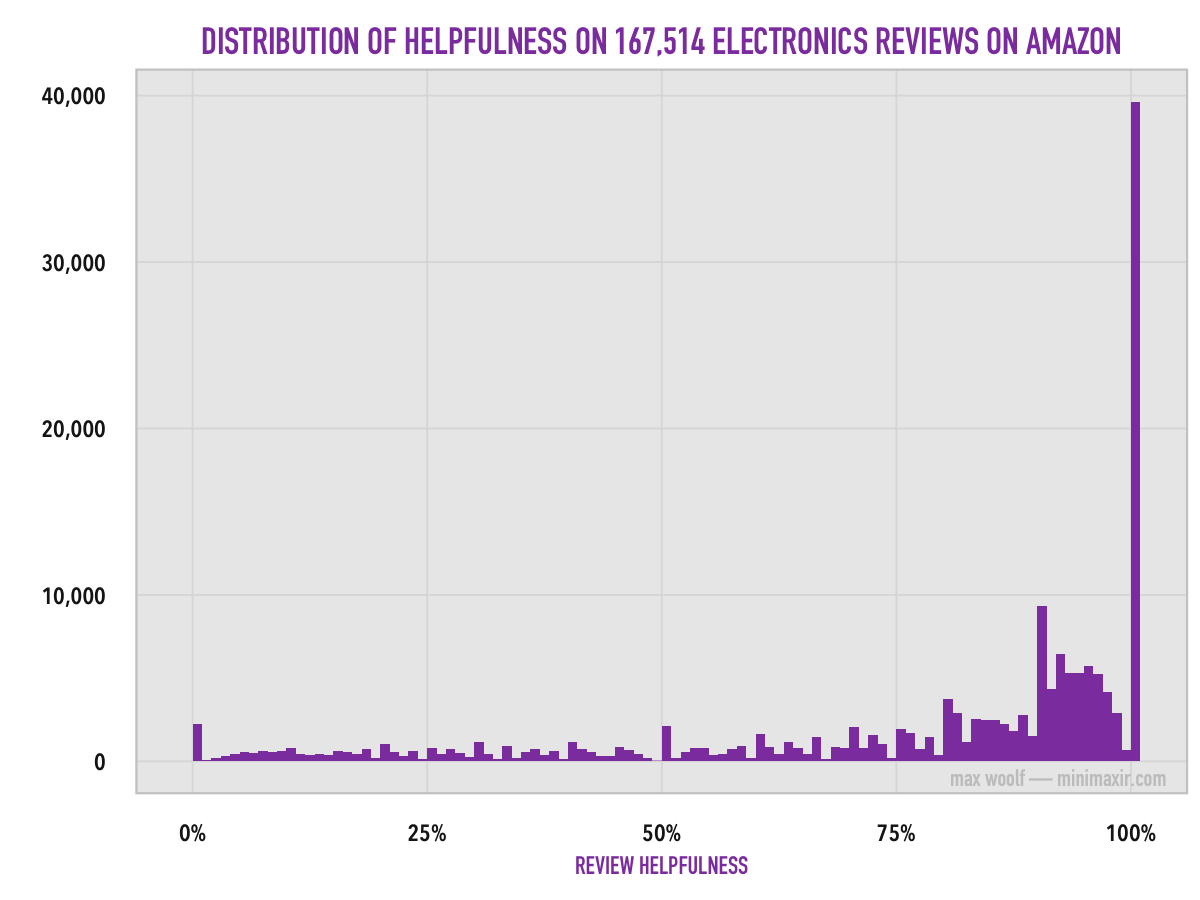
That would make sense; if you’re writing a review (especially a 5 star review), you’re writing with the intent to help other prospective buyers.
Another consideration is review length. Do reviews frequently write essays, or do reviews typically write a single paragraph?
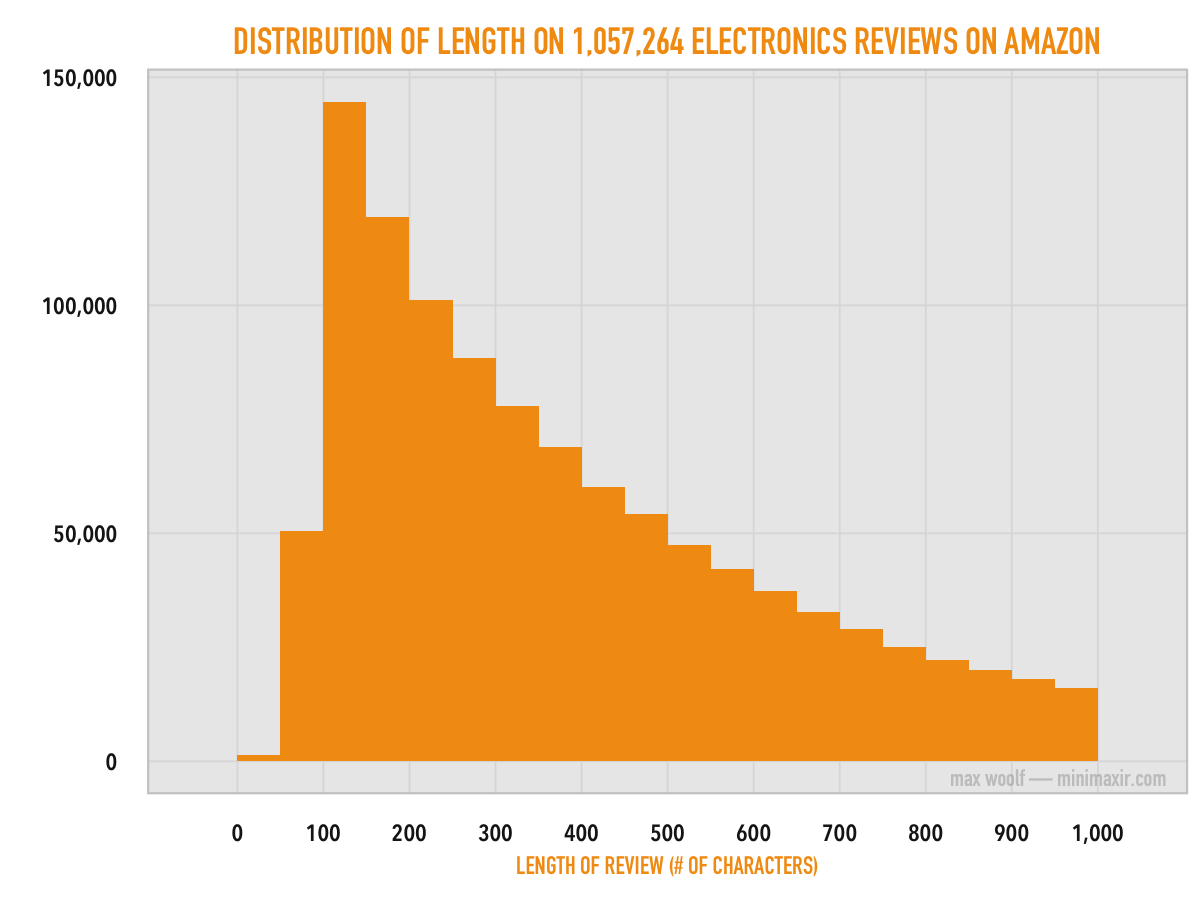
Most reviews are 100-150 characters, but the average amount of characters in a review is about 582 (there are some outlier reviews with 30,000+ characters!). Assuming that the average amount of characters in a paragraph is 352, reviewers typically write about half a paragraph. Interestingly, reviews are rarely less than a sentence. (the Review Guidelines suggest a minimum of 20 words in a review, so this discrepancy could be attributed to moderator removal of short, one-liner reviews)
Particularizing the Products
The 1.2 million reviews in the Electronics data set address about 82,003 distinct products. However, most of those entries represent different SKUs of the same product (e.g. different colors of headphones). Of those products, only 30,577 products have pricing information which identify them as the source product.
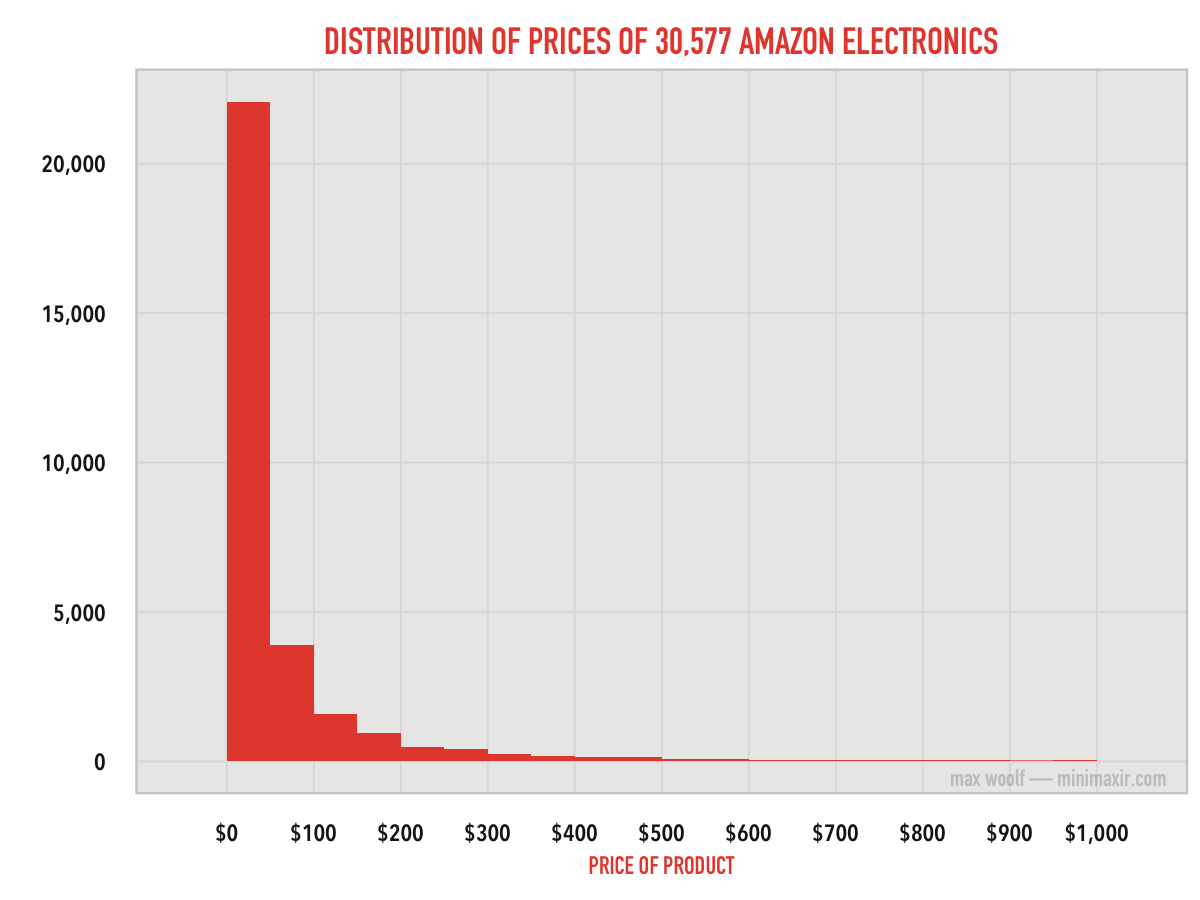
Over 2/3rds of Amazon Electronics are priced between $0 and $50, which makes sense as popular electronics such as television remotes and phone cases are not extremely expensive. However, there’s no statistical correlation between the price of a product and the number of reviews it receives.
For the overall rating of a particular product, which is the average rating of all reviews for that product, the ratings are no longer limited to discrete numbers between 1 and 5, and can take decimal values between those numbers as well. The distribution of product ratings is similar to the distribution of review ratings.
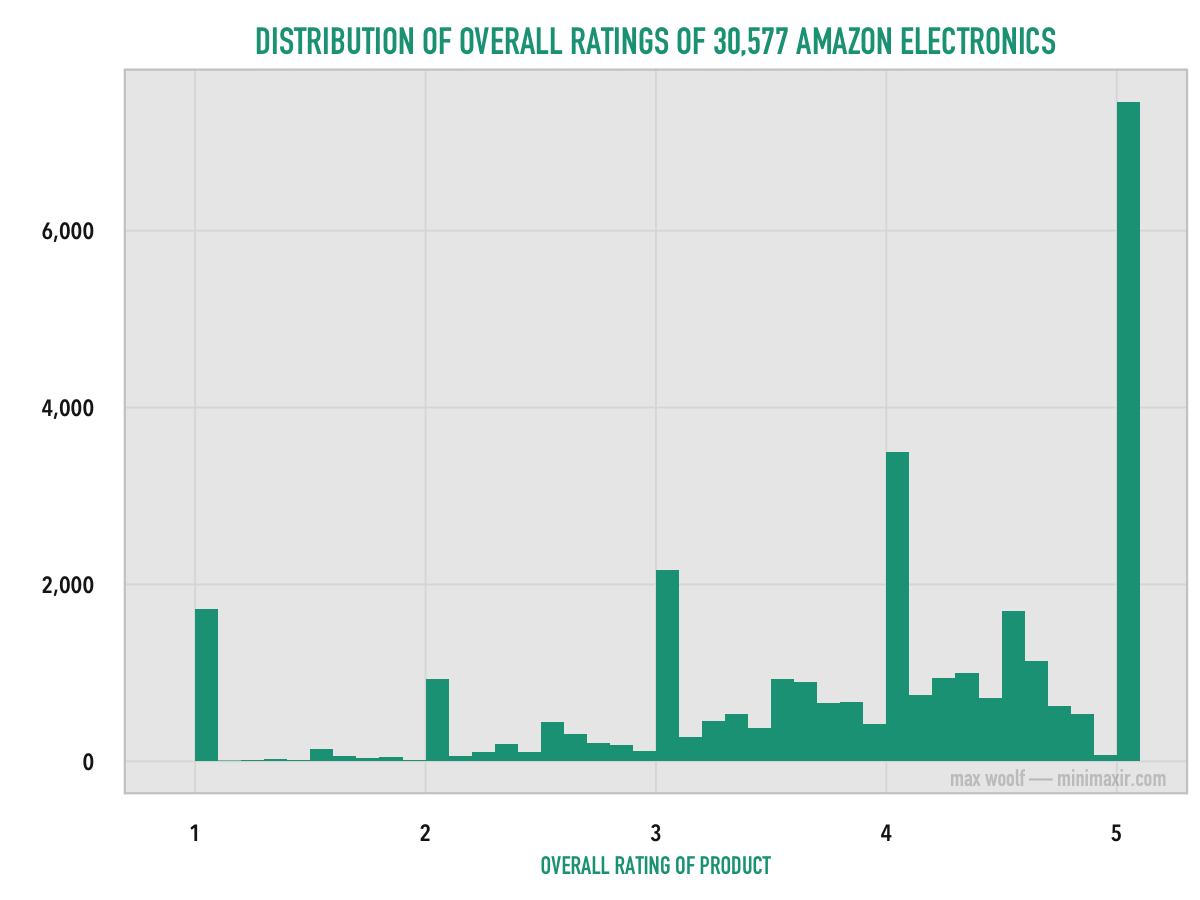
Again, the perfect rating of 5 is most popular for products. This distribution resembles the distribution of scores of all reviews for the discrete rating values, but this view reveals local maxima at the midpoint between each discrete value. (i.e. 3-and-a-half stars and 4-and-a-half stars are surprisingly common ratings)
What happens when you plot product rating and product price together?
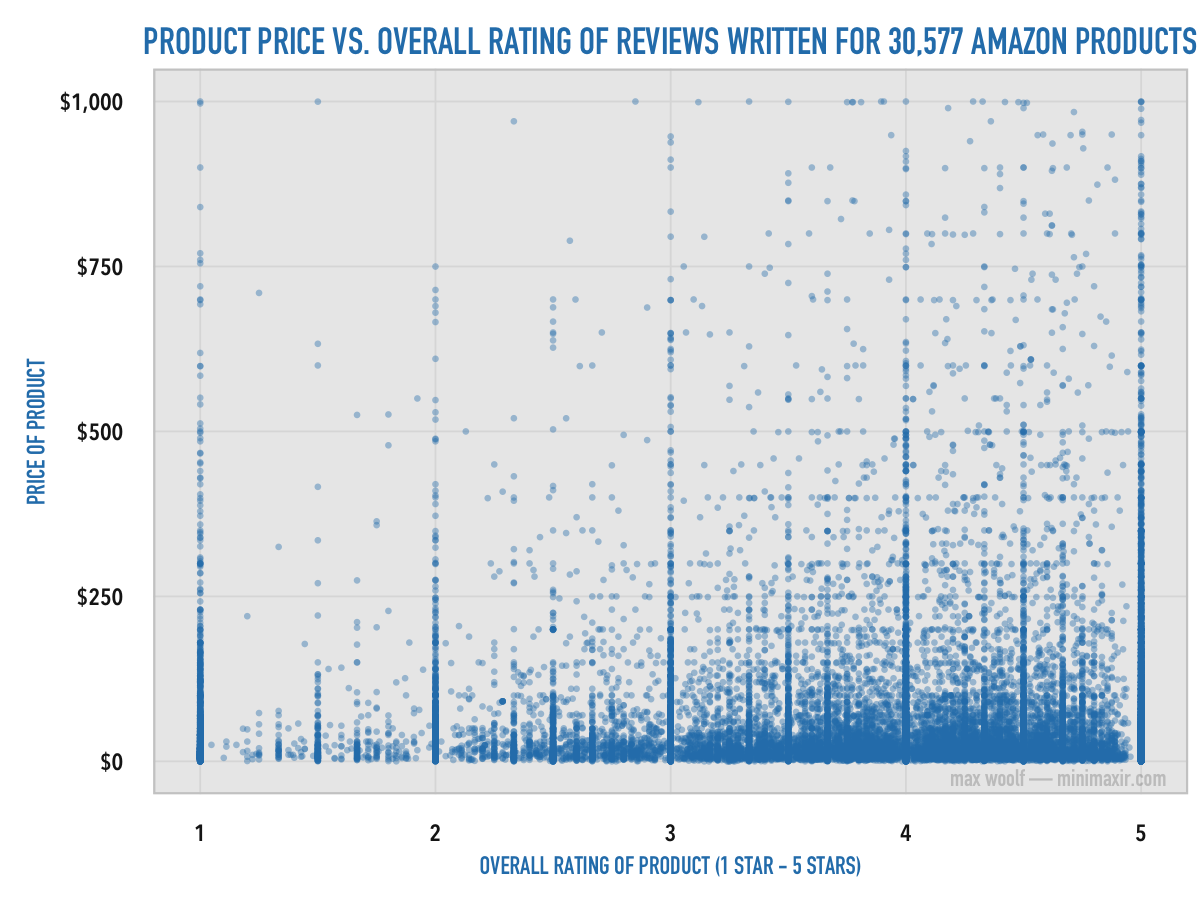
The most expensive products have 4-star and 5-star overall ratings, but not 1-star and 2-star ratings. However, the correlation is very weak. (r = 0.04)
In contrast, the relationship between product price and the average length of reviews for the product is surprising.
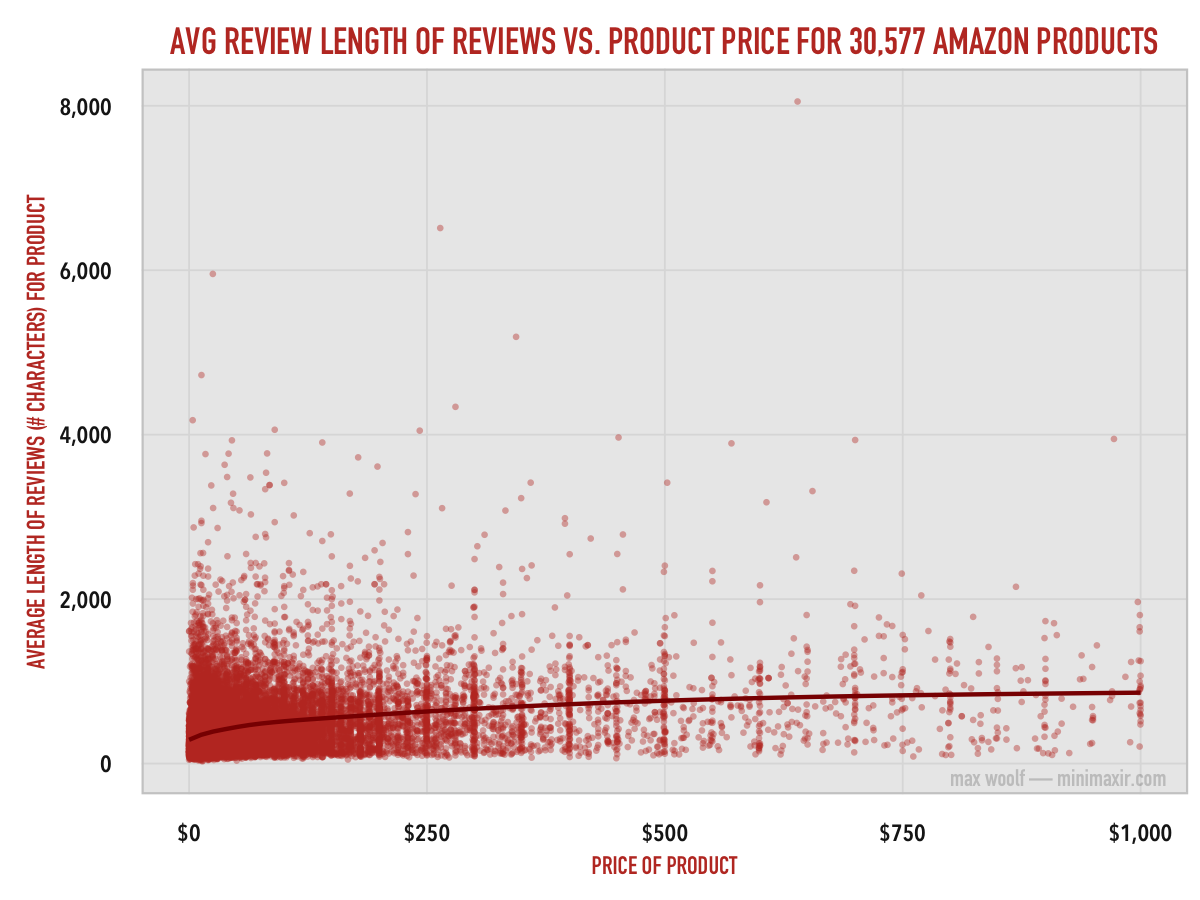
This relationship is logarithmic with a relatively good correlation (r = 0.29), and it shows that reviewers put more time and effort into reviewing products which are worth more.
Reviewing the Reviewers
As you might expect, most people leave only 1 or 2 reviews on Amazon, but some have left hundreds of reviews. Out of 1.2 Million reviews, there are 510,434 distinct reviewers.
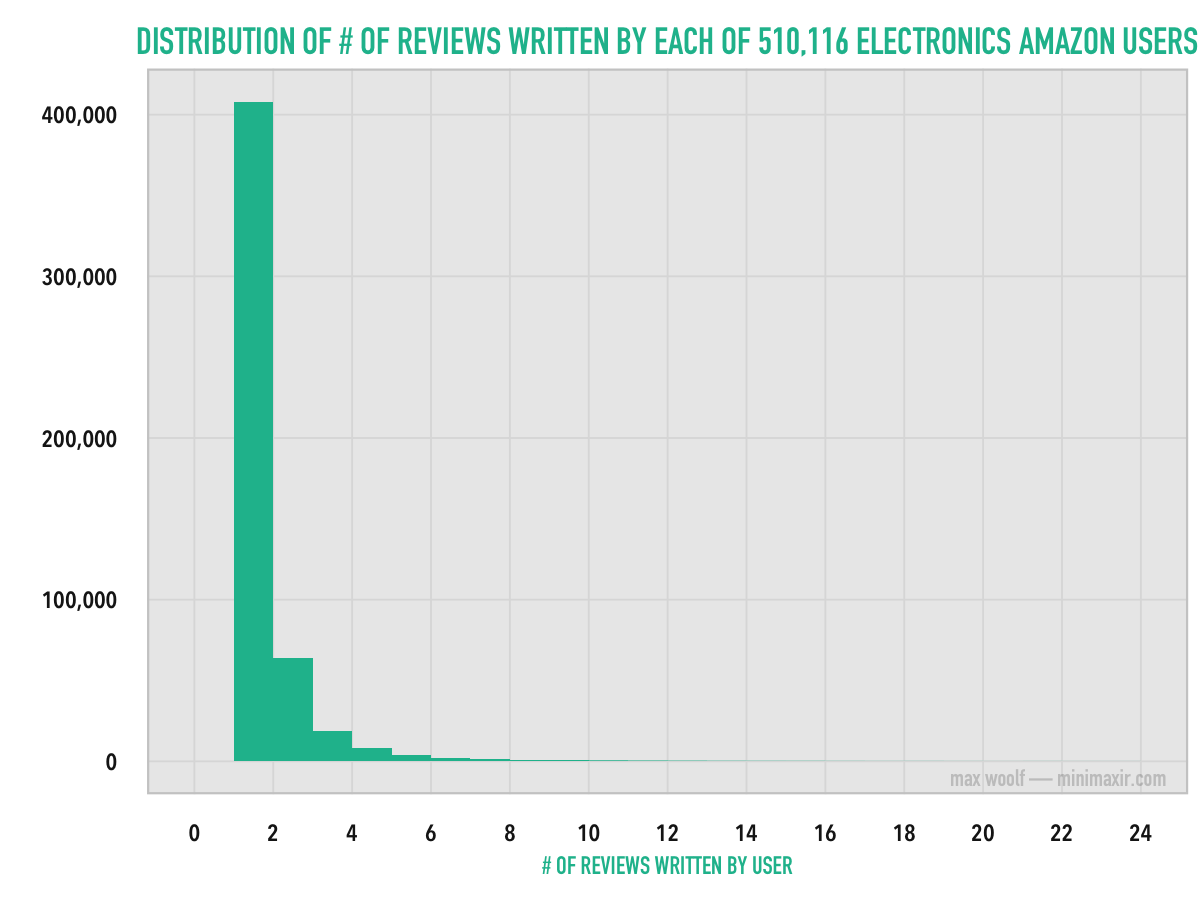
Over 80% of the reviewers of Amazon electronics left only 1 review. Analyzing reviewers who have left only 1 review is not helpful statistically, so for the rest of the analysis, only reviews who have made 5 or more reviews (which have received atleast 1 is-helpful/is-not-helpful indicator) will be considered. This makes it much easier to get the overall profile of a reviewer. 11,676 reviewers fit this criteria.
Do repeat Amazon users tend to give 5-star reviews?
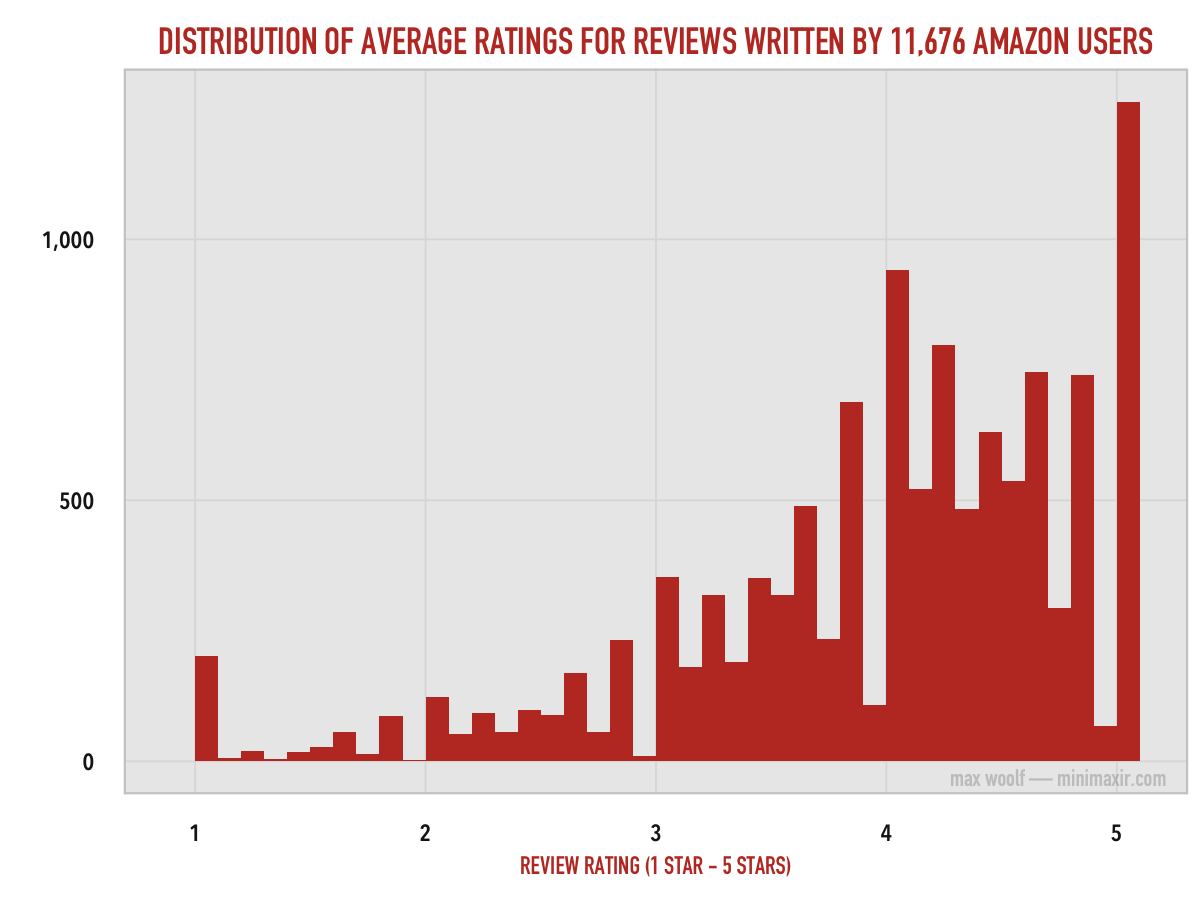
Distribution of review ratings when averaged across is similar to the other distributions of review ratings. However, this distribution is less skewed toward 5-stars and is more uniform between 4-stars and 5-stars.
What about the average helpfulness of the reviews written by a single reviewer? If a reviewer has enjoyed Amazon enough such that they make 5 or more reviews, chances are that their reviews are high quality.
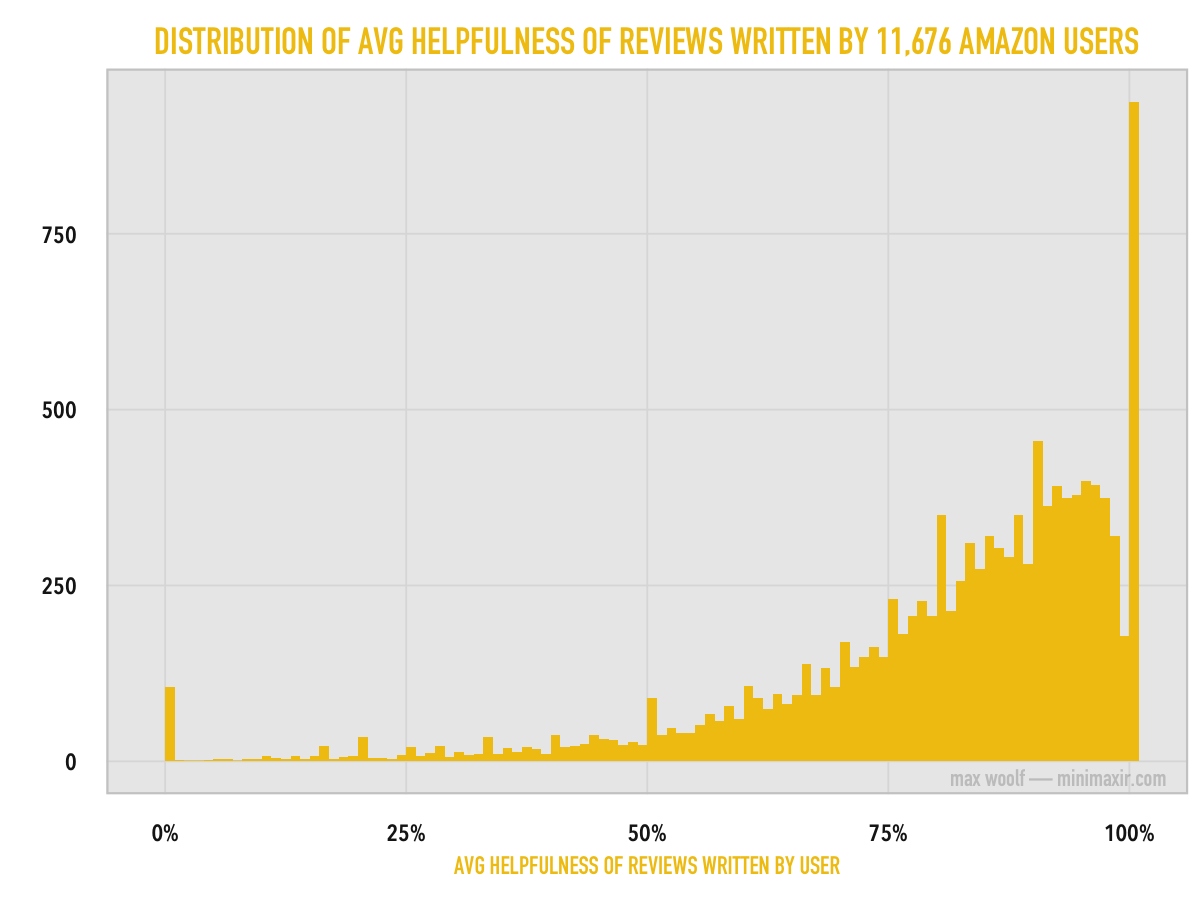
Again, the data is slightly skewed. 8% of the reviewers have perfect helpfulness scores on all their reviews, and the average helpfulness score for all repeat reviews is 80%. Interestingly, a few repeat reviewers have average helpfulness scores of 0.
If you plot both average score and average helpfulness in a single chart, the picture becomes much more clear:
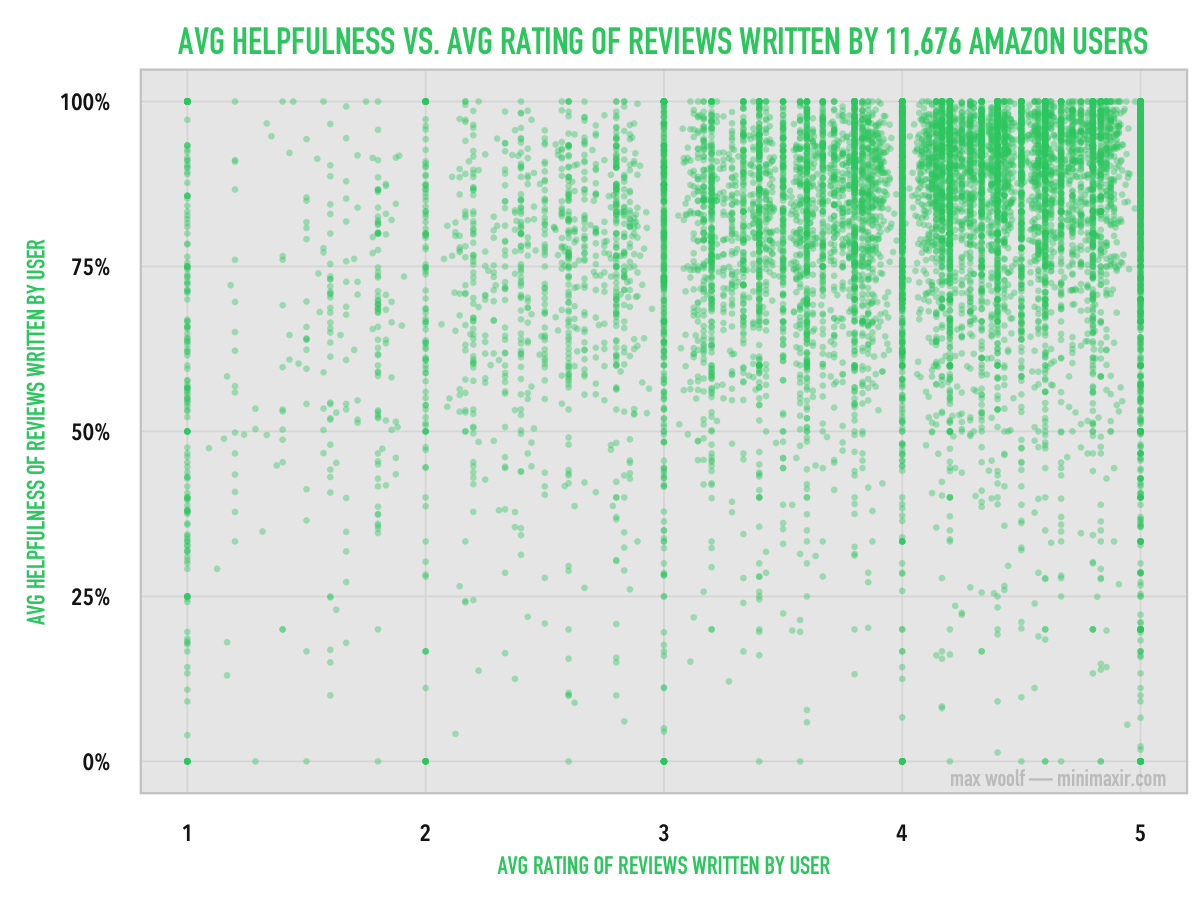
As the chart shows, there’s a good positive correlation (r = 0.27) between rating and helpfulness, with a discernible cluster at the top. However, I don’t think it’s a causal relationship. Reviewers who give a product a 4 - 5 star rating are more passionate about the product and likely to write better reviews than someone who writes a 1 - 2 star “this product sucks and you suck too!” review.
Another interesting bivariate relationship is the relationship between the helpfulness of a review and the length of a review). Stereotypically, you might think that longer reviews are more helpful reviews. And in the case of Amazon’s Electronics reviews, you’d be correct.
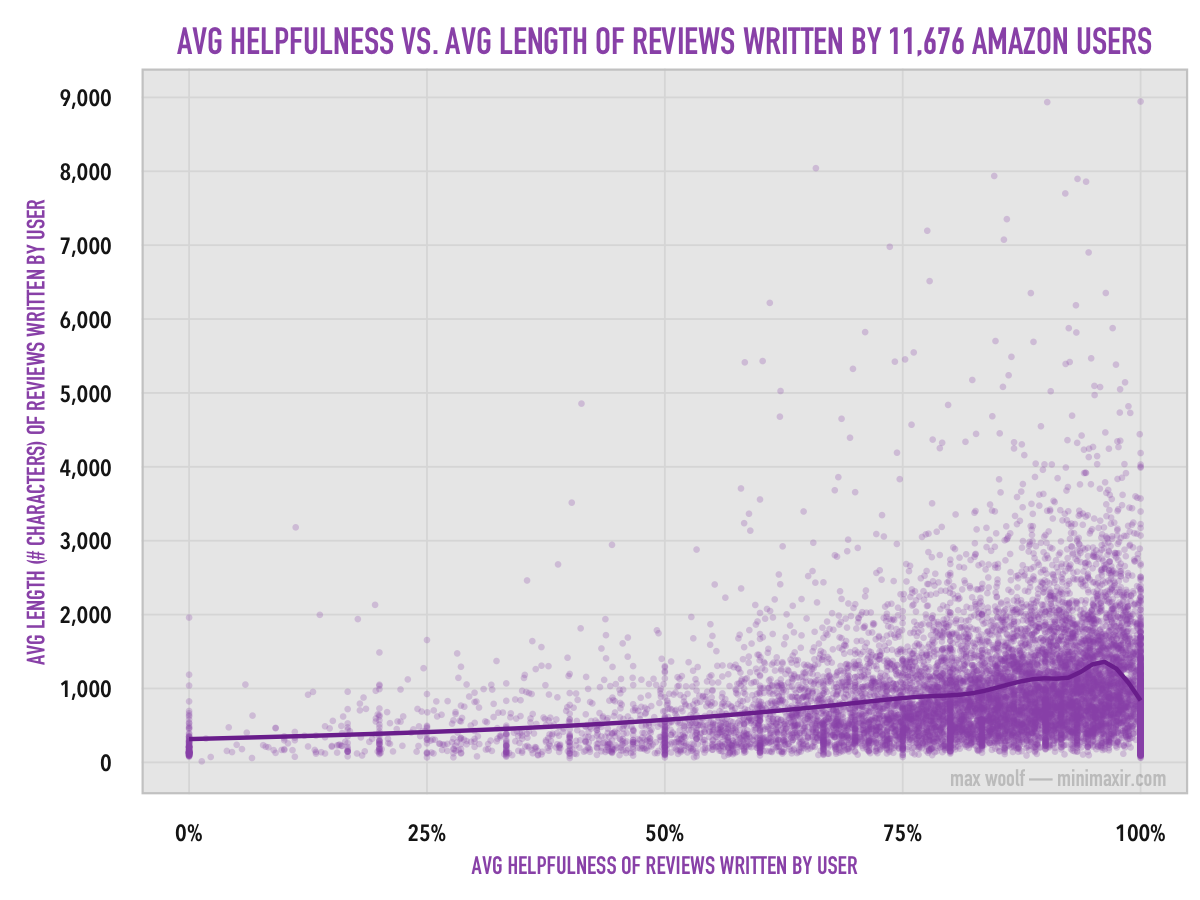
Again, there’s a good positive correlation (r = 0.26) between average helpfulness and average length, which the trend line supports. (the dip at the end is caused by the high amount of low-character reviews). All the longer reviews have high helpfulness; there are very, very few unhelpful reviews that are also long.
Completing the Conclusion
The reviews on Amazon’s Electronics products very frequently rate the product 4 or 5 stars, and such reviews are almost always considered helpful. 1-stars are used to signify disapproval, and 2-star and 3-stars reviews have no significant impact at all. If that’s the case, then what’s the point of having a 5 star ranking system at all if the vast majority of reviewers favor the product? Would Amazon benefit if they made review ratings a binary like/dislike?
Having a 5-star system can allow the prospective customer to make more informed comparisons between two products: a customer may be more likely to buy a product that’s rated 4.2 stars than a product that is rated 3.8 stars, which is a subtlety that can’t easily be emulated with a like/dislike system. Likewise, if products are truly bad, the propensity toward 5-star reviews can help obfuscate the low quality of the product when a like/dislike system would make the low quality more apparent.
Unfortunately, only Amazon has the data that would answer all these questions.
Of course, there are many other secrets to be uncovered from Amazon reviews. The Stanford professors who collected the initial data used machine learning techniques on the review text to predict the rating given by a review from just the review text itself. Other potential topics for analysis are comparisons between types of Electronics (e.g. MP3 players, headphones) or using natural language processing to determine the common syntax in reviews.
That’s a topic for another blog post. :)
