Reddit has certainty received more attention in the mainstream media with its involvement in such events as the Boston Marathon Bombings and President Obama’s AMA. But has this publicity led to increase in overall activity on the site?
I analyzed the daily number of submissions from over two years, August 6th, 2011 to September 25, 2013 (41 million submissions total), to see which events, if any, have affected Reddit’s growth rate. As it turns out, Reddit grows by itself.
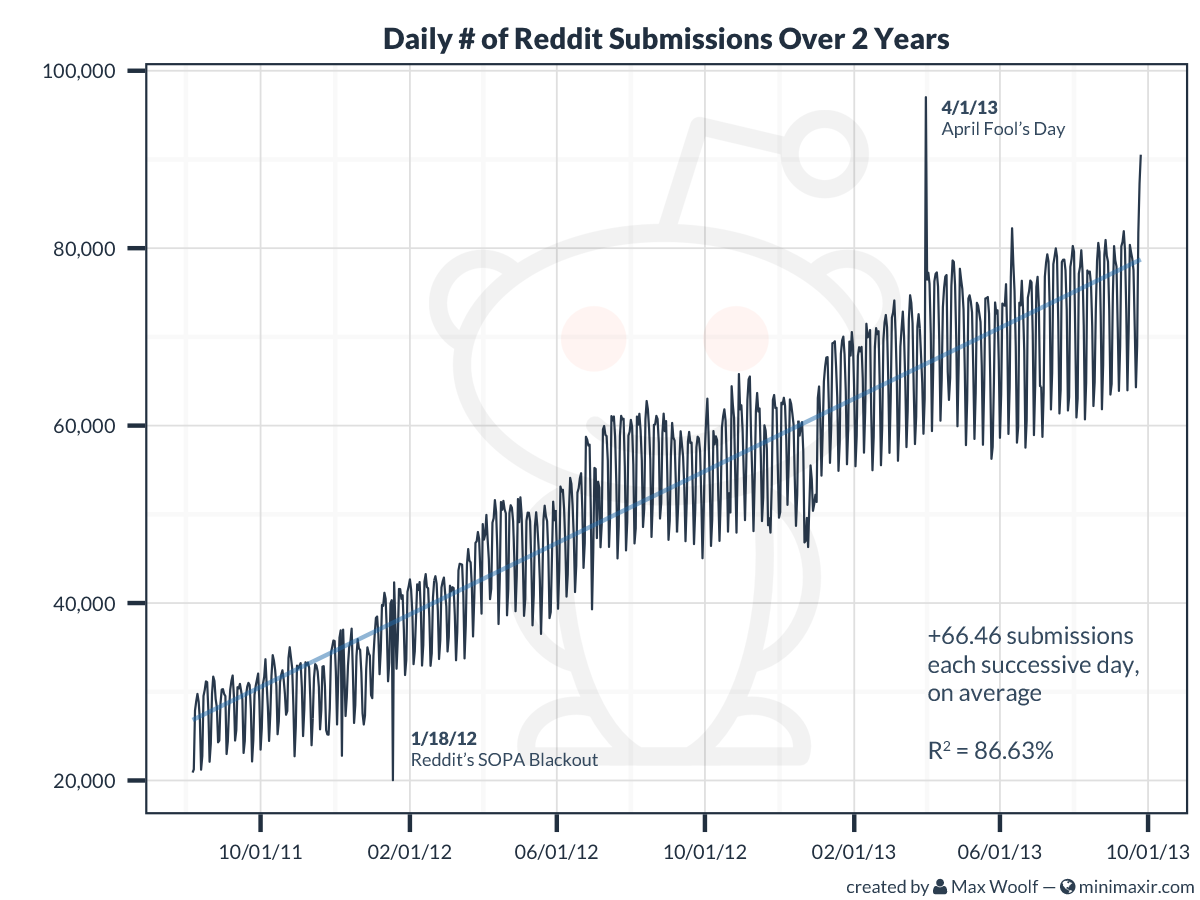
Reddit’s growth over the past two years has been almost entirely linear, with no notable acceleration in submission activity at any point in time.
Running a linear regression on daily number of submissions vs. number of days since the first date (8/6/11) reveals that the expected increase in number of submissions each successive day on average is 66.48 submissions (+1,948 submissions each successive month, +24,259 submissions each successive year)
This growth rate alone explains 86.83% of the variation in number of submissions, indicating that external factors such as media publicity explain the remaining 13% of the variation.
From a business perspective, it’s impressive that Reddit still continues to grow for being such a mature internet business, but prospective investors for a rumored fundraising at a $400 Million valuation might be weary that Reddit’s growth is only linear, in contrast to the exponential growth of other startups such as Snapchat. (In fairness, submission activity may not necessarily correlate with revenue-driving content consumption activity)
A couple stray observations:
On January 18th, 2012, the daily number of Reddit submissions hit the minimum among the two-year period due to Reddit’s participation in the Internet blackout in protest of SOPA. (Reddit’s blackout was only from 8AM to 8PM EST, which is why there are a nonzero number of submissions for that day).
On April 1st, 2013, the daily number of Reddit submissions hit the maximum among the two-year period due to April Fool’s Day, and the numerous amount of submissions for X brand/website’s well-timed joke. However, I’m not entirely sure why there’s a spike for April Fool’s Day in 2013, but not April Fool’s Day in 2012.
You can access the data used to create the time-series chart at this Google Spreadsheet.
